

How to Use Drawing Tools (Original K-Line)
Website
App
Popular Articles
View More
Will XRP Finally Benefit From Ripple's MiCA CASP License in Europe? What Every Holder Needs to Know
Ripple just scored one of its biggest regulatory wins in years. On June 23, 2026, Luxembourg's financial regulator gave the company a preliminary green light to operate as a licensed crypto asset

Why Is XRP Going Up Right Now? The Iran Ceasefire, The Strait Of Hormuz, And What It Means For XRP
XRP surged roughly 7 percent on the week after the United States and Iran announced a ceasefire agreement on June 14, bouncing hard off a four-month low as geopolitical fear started to lift. The

XRP vs Bitcoin Comparison: Speed, Utility, and What Each One Actually Does
Most people searching "XRP Bitcoin" aren't confused about which is which. They're asking a sharper question: if I had to choose between the two, what am I actually choosing between? This article

Hot Crypto Updates
View More
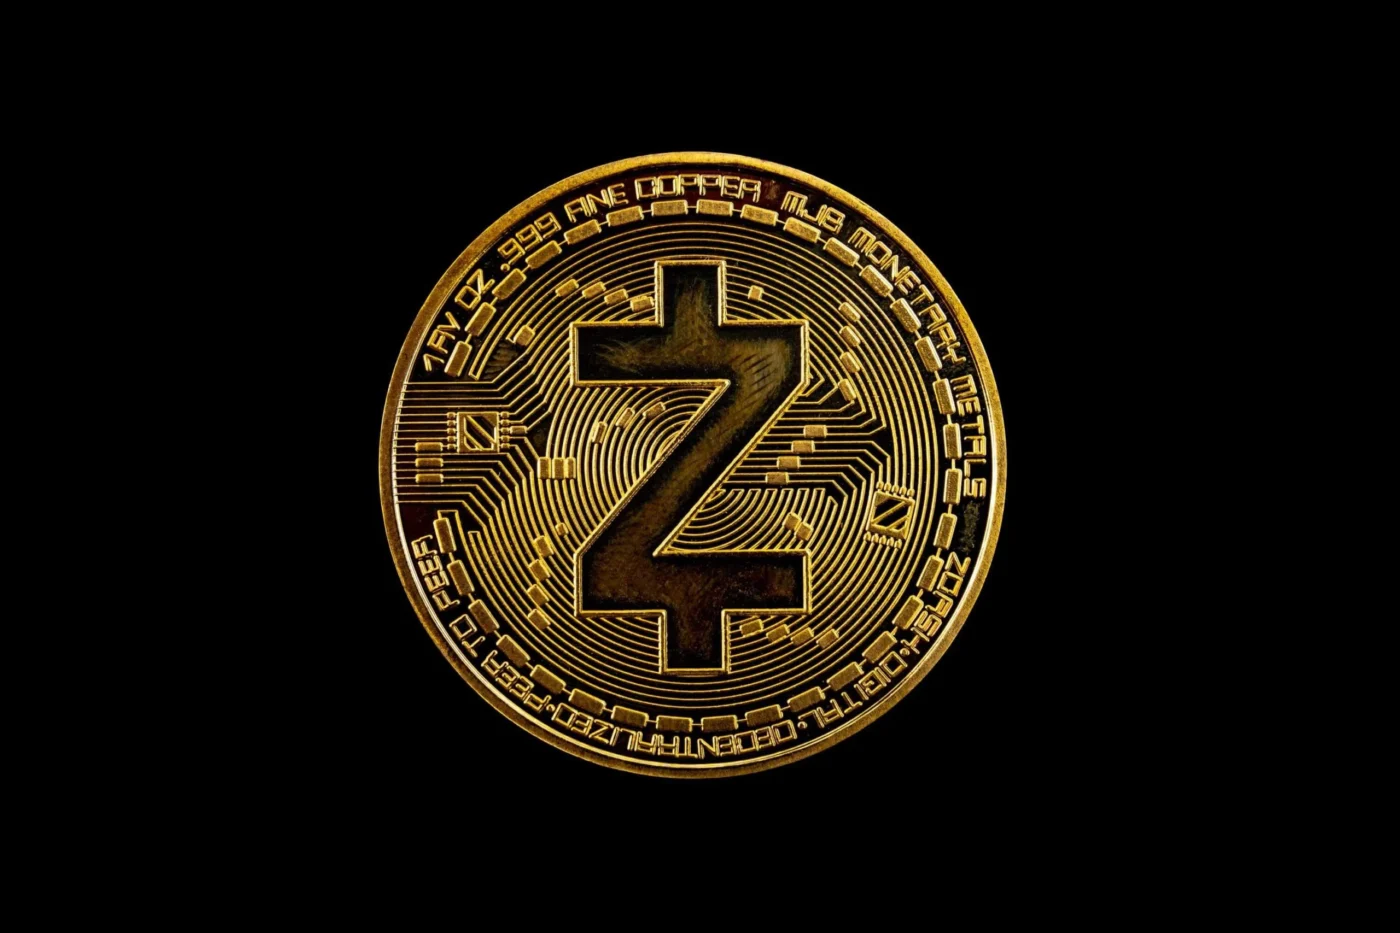
ZEC Plunges on Infinite Mint Fears: Analyzing the Market Fallout of the Orchard Bug
Overview Zcash (ZEC) lost roughly half its value in 48 hours in early June 2026, falling from a June 4 peak near $624 to about $309 on June 5 after Shielded Labs disclosed a critical soundness flaw

Zcash (ZEC) Orchard Vulnerability Explained: A 4-Year Counterfeiting Bug, a 40% Crash, and an Emergency Hard Fork
Zcash (ZEC) was climbing toward $700 and outperforming much of the market when a single disclosure flipped the narrative. On June 5, 2026, word spread that Zcash's Orchard shielded pool had carried a

ZEC Bug Panic: Why Whales Are Dumping NEAR and HYPE to Save Leverage
A four-year-old zero-knowledge proof flaw in Zcash's Orchard pool sparked a 31% ZEC crash and dragged down HYPE, NEAR, and the broader altcoin market. Here's everything you need to know. Overview In

Trending News
View More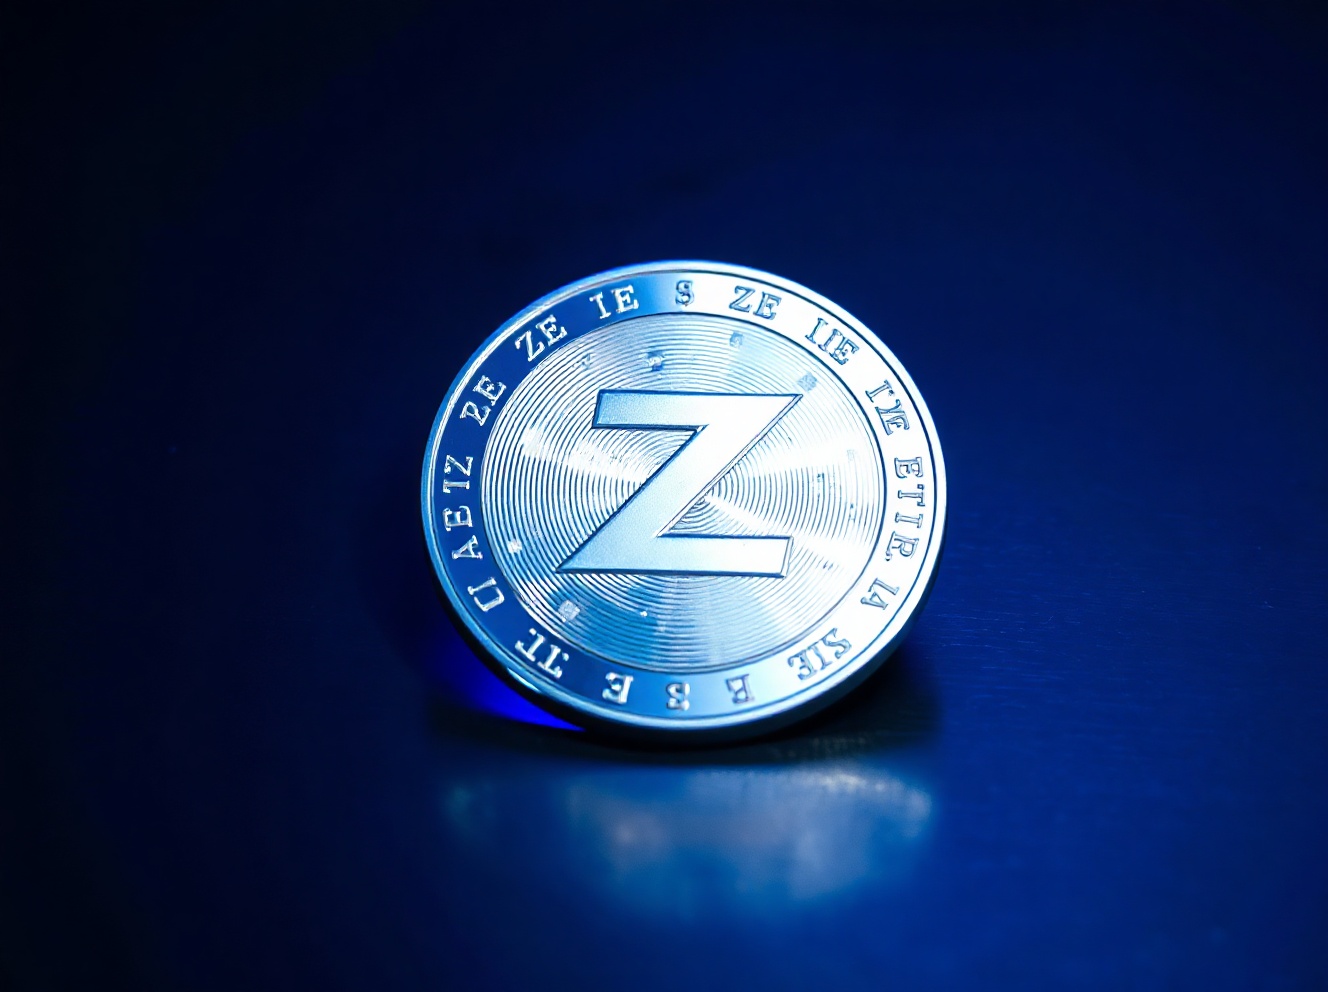
Zcash (ZEC) Price Outlook 2026–2030: Privacy Coin Fundamentals and Market Potential
BitcoinWorld Zcash (ZEC) Price Outlook 2026–2030: Privacy Coin Fundamentals and Market Potential Privacy-focused cryptocurrencies occupy a distinct and often contentious
Garrett Jin Launches Massive $21.7M Short Position on Zcash (ZEC) via Hyperliquid
Garrett Jin opens a $21.73M Zcash short on Hyperliquid at $418.90 while his Bitcoin long position remains underwater with $20M in losses. The post Garrett Jin Launches

Related Articles
View More
How to Use TradingView on MEXC
TradingView is a powerful trading analysis tool that caters to users of all experience levels. MEXC has integrated TradingView's charting tools, allowing you to use them directly on the MEXC platform.

Analysis of Common Technical Indicators in the Cryptocurrency Market
In crypto trading, technical indicator analysis refers to a quantitative method that uses mathematical and statistical formulas to assess market trends. By processing price and volume data through spe

What Is the Stochastic Indicator (KDJ)?
The Stochastic Indicator (KDJ) is a technical analysis tool that analyzes price trends to assess market strength and identify overbought and oversold conditions, helping traders make buy and sell deci


