

How to Use TradingView on MEXC

How to Use TradingView on MEXC
1. Setting Up the K-Line Chart
2. Common Drawing Tools
3. Using Technical Indicators
4. Time Zone Settings
5. Chart Settings
- Candles: Customize the candle colors, price line colors, precision, and time zone.
- Symbol: Settings for the text information at the top of the K-line chart, including whether to display OHLC values, bar change values, and volume.
- Labels: Offers various options to integrate labels into the chart, such as symbol name, high and low price, and countdown to bar close labels.
- Chart Basic Styles: Customize the chart's background color, grid line color, and other settings.
6. How to Reset the Chart
Popular Articles
View More
XRP Price Analysis: Can XRP Hold Support After the Pullback?
XRP is trading near a key short-term zone after losing momentum over the past week. As of June 29, 2026, the MEXC XRP price page shows XRP near $1.04, down around 0.88% over 24 hours and roughly

Will Coinbase Stock Hit $500? COIN Price Prediction for 2027 and 2030
Coinbase stock hit an intraday all-time high of $444.64 on July 18, 2025. By February 2026, the same stock was trading at $139, a decline of more than 68% in under seven months. As of June 25, 2026,

MEXC Card vs. MEXC Ether.Fi Card: Which Crypto Visa Card Is Right for You?
MEXC currently offers two distinct Visa cards for crypto users — the MEXC Card and the MEXC Ether.Fi Card — and while both let you spend cryptocurrency in everyday life, they are built on

Hot Crypto Updates
View More
Stablecoin Shortage in India: Why Traders Are Paying an 8.5% Premium for Crypto Dollars
India’s cryptocurrency market is facing an unusual situation: traders are paying significantly more than the global value of dollar-pegged digital assets, especially USDT (Tether), as a shortage of

MoneyGram Becomes a Solana Validator When Traditional Remittance Companies Start Building Blockchain Infrastructure
MoneyGram has officially become a validator on the Solana network, marking a new milestone in the blockchain strategy of one of the world's largest money transfer companies. The move comes just weeks

How Qualcomm and Micron Sparked a $400 Billion AI Stock Surge
The artificial intelligence (AI) investment boom received a powerful new boost on June 24, 2026, when semiconductor giants Qualcomm and Micron Technology delivered forecasts that reignited investor

Trending News
View More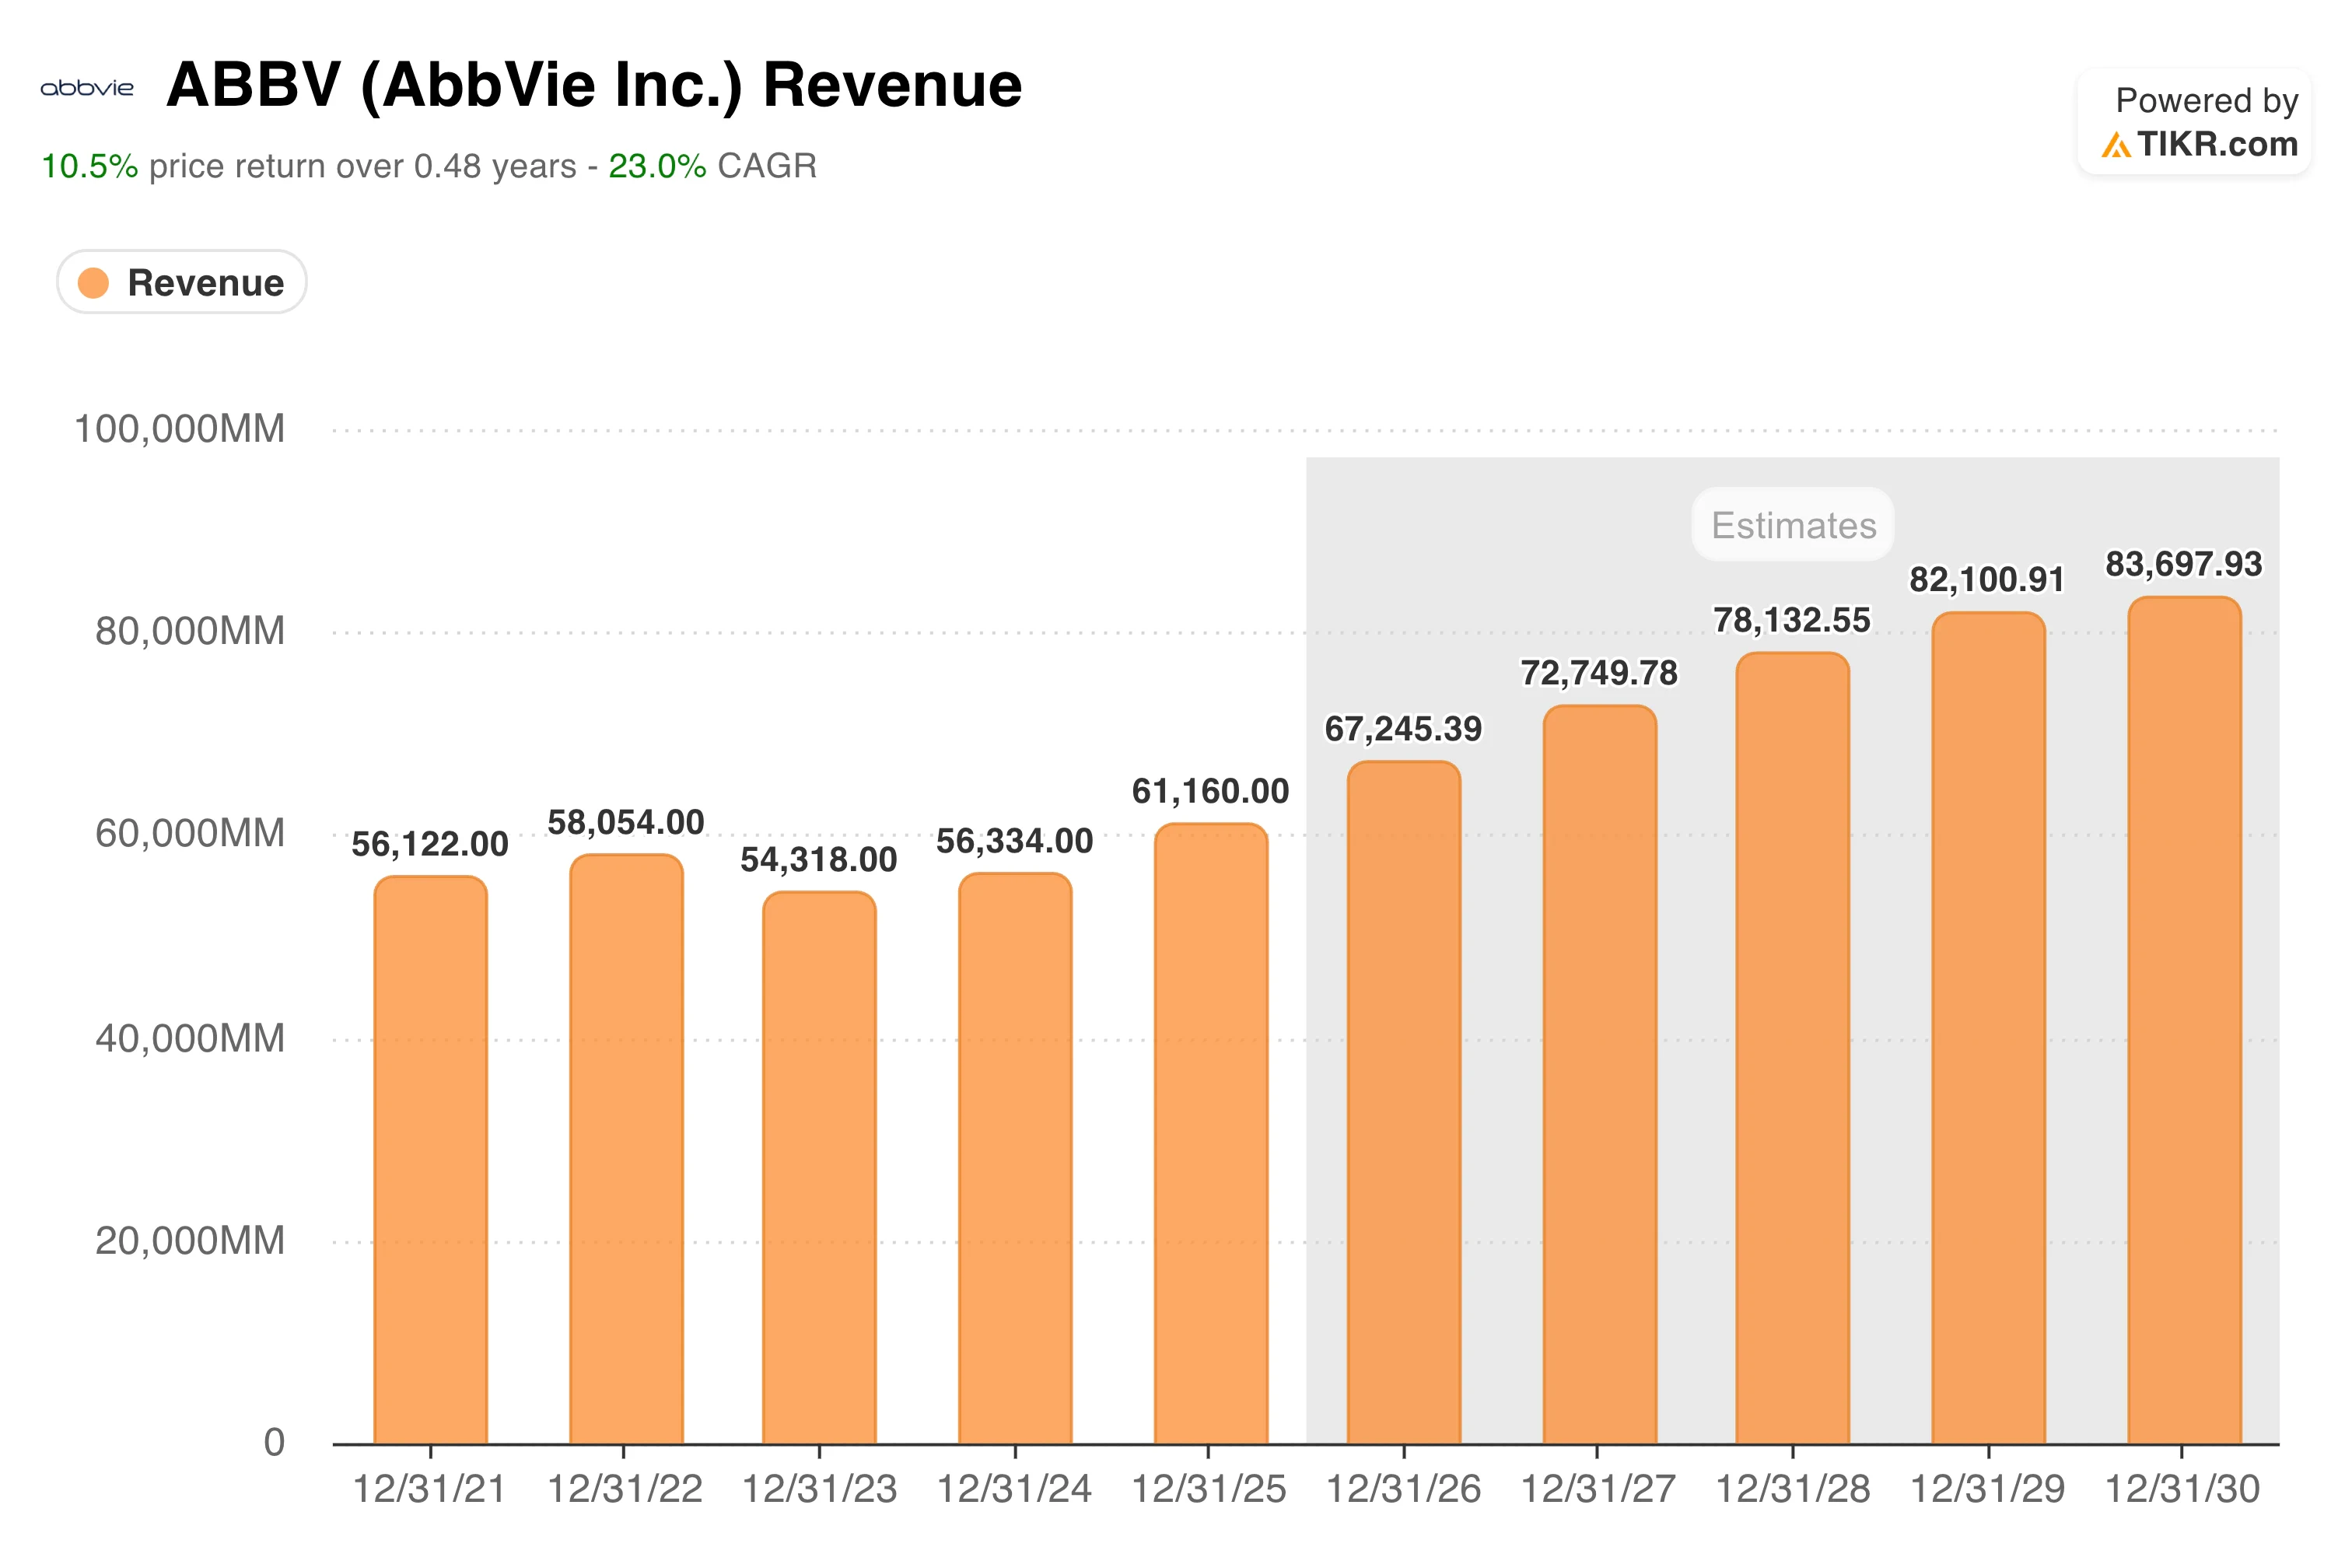
Skyrizi Just Hit $4.5 Billion in a Single Quarter, AbbVie’s Humira Problem Is Solved
AbbVie Inc. spent years preparing for the loss of its blockbuster drug Humira, and the Q1 2026 results confirm the replacement is working better than most expected

Amazon (AMZN) Stock Jumps 5% as Prime Day Breaks Records and Analysts Pile In
TLDR Amazon stock rose as much as 4.8% Monday morning after Prime Day generated a record $26.4 billion in consumer spending, up 9.3% year-over-year. Wells Fargo


Related Articles
View More
Analysis of Common Technical Indicators in the Cryptocurrency Market
In crypto trading, technical indicator analysis refers to a quantitative method that uses mathematical and statistical formulas to assess market trends. By processing price and volume data through spe

What Is the Stochastic Indicator (KDJ)?
The Stochastic Indicator (KDJ) is a technical analysis tool that analyzes price trends to assess market strength and identify overbought and oversold conditions, helping traders make buy and sell deci

What is Parabolic SAR?
The Parabolic SAR (Stop and Reverse) is a widely used technical analysis tool designed to determine the direction of price trends and identify potential reversal points. This indicator plots a series


