

What Is the Stochastic Indicator (KDJ)?
1. Components of the Stochastic Indicator
- K Line: The fast line, representing the relative position of the current price within the highest and lowest prices of the period. A value near 100 indicates the price is close to the highest level, while a value near 0 suggests it is near the lowest.
- D Line: The slow line, derived from the K line using smoothing techniques to reduce market noise and reflect trend changes.
- J Line: The most sensitive line, reacting faster and with greater amplitude than the K and D lines.
2. Basic Principles of the Stochastic Indicator
2.1 Identifying Overbought and Oversold Conditions
2.2 Buy and Sell Signals
2.3 Using the J Line to Identify Market Tops and Bottoms
3. Advantages and Disadvantages of the Stochastic Indicator
4. How to Use KDJ on MEXC
Popular Articles
View More
XRP Price Analysis: Can XRP Hold Support After the Pullback?
XRP is trading near a key short-term zone after losing momentum over the past week. As of June 29, 2026, the MEXC XRP price page shows XRP near $1.04, down around 0.88% over 24 hours and roughly

Will Coinbase Stock Hit $500? COIN Price Prediction for 2027 and 2030
Coinbase stock hit an intraday all-time high of $444.64 on July 18, 2025. By February 2026, the same stock was trading at $139, a decline of more than 68% in under seven months. As of June 25, 2026,

MEXC Card vs. MEXC Ether.Fi Card: Which Crypto Visa Card Is Right for You?
MEXC currently offers two distinct Visa cards for crypto users — the MEXC Card and the MEXC Ether.Fi Card — and while both let you spend cryptocurrency in everyday life, they are built on

Hot Crypto Updates
View More
Bitcoin ETF Outflows Explained: Why Institutions Are Selling (And Retail Isn't)
Overview June 2026 delivered the worst monthly outflow in spot Bitcoin ETF history: 4.06 billion dollars exited US funds, surpassing the previous record of 3.56 billion dollars set in February 2025.

ETH Just Crashed Below $1,700 — Is This the Bottom or a Trap?
Overview Ethereum has had a brutal 2026. From a peak near $4,954 in August 2025, ETH tumbled more than 60 percent, briefly touching the $1,600 zone in June after nine consecutive months of selling

Stablecoin Shortage in India: Why Traders Are Paying an 8.5% Premium for Crypto Dollars
India’s cryptocurrency market is facing an unusual situation: traders are paying significantly more than the global value of dollar-pegged digital assets, especially USDT (Tether), as a shortage of

MoneyGram Becomes a Solana Validator When Traditional Remittance Companies Start Building Blockchain Infrastructure
MoneyGram has officially become a validator on the Solana network, marking a new milestone in the blockchain strategy of one of the world's largest money transfer companies. The move comes just weeks
Trending News
View More
MetaMask Introduces Money Account Featuring mUSD Rewards and Payment Integration
MetaMask's Money Account offers mUSD yield up to 4% APY, direct payments, and trading from one self-custody balance. Learn about the new crypto finance platform
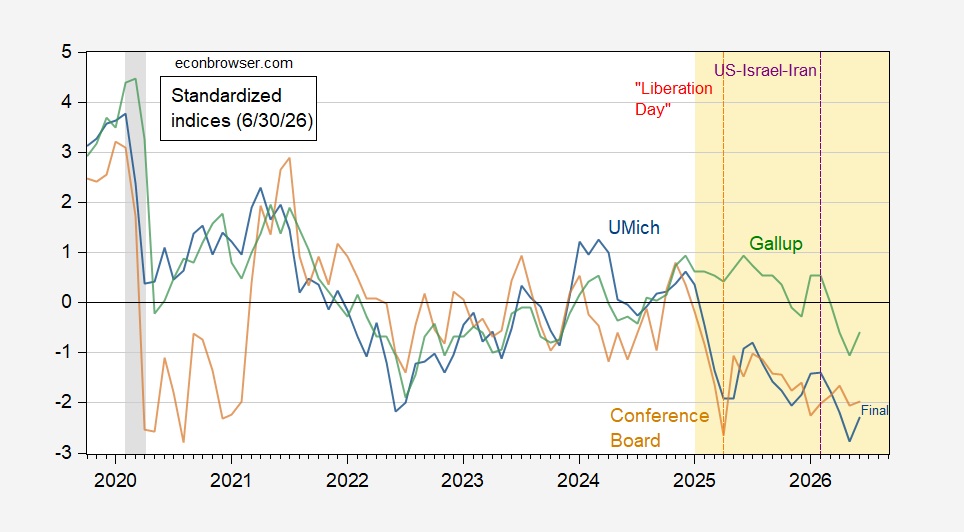
Conference Board Index Still in Gloomy Range
Confidence rises to 91.2, but below consensus (94.4), from downwardly revised level. Gallup also rises. Figure 1: U.Michigan Economic Sentiment (blue), Conference


Related Articles
View More
How to Use TradingView on MEXC
TradingView is a powerful trading analysis tool that caters to users of all experience levels. MEXC has integrated TradingView's charting tools, allowing you to use them directly on the MEXC platform.

Analysis of Common Technical Indicators in the Cryptocurrency Market
In crypto trading, technical indicator analysis refers to a quantitative method that uses mathematical and statistical formulas to assess market trends. By processing price and volume data through spe

What is Parabolic SAR?
The Parabolic SAR (Stop and Reverse) is a widely used technical analysis tool designed to determine the direction of price trends and identify potential reversal points. This indicator plots a series


