Bitcoin Liquidity Builds Near 78K As Price Compresses Around 80K
Bitcoin trades near $78K as liquidity builds around $80K, with key BTC levels at $92K, $98K, $71K and $65K.
Bitcoin liquidity is building near $78K as BTC/USD trades close to the $80K region.
The daily chart shows price moving in a tight range after a sharp retreat from higher levels.
Traders are tracking nearby liquidity clusters, while wider zones near $92K, $98K, $71K, and $65K remain important.
Bitcoin Liquidity Clusters Form Around $78K
Bitcoin has liquidity clusters placed above and below current price. The $78K area is the closest zone under watch.
BTC was trading near $78,225 on the daily chart, with the price down about 1.06% during the session.
This area matters because price is holding near a narrow range. Liquidity can build when buyers and sellers place orders around the same zone.
That setup can create a stronger move when one side gives way.
When the chart is viewed from a wider range, more liquidity zones appear. The $92K and $98K levels sit above current prices.
The $71K and $65K levels sit below price and remain downside areas to track.
The longer Bitcoin compresses around $80K, the more liquidity can form on both sides.
This may lead to a larger move later. The direction depends on whether buyers or sellers lose control first.
BTC Price Compresses Around $80K
The chart shows Bitcoin falling from a prior high zone near $119K to $126K. The decline followed a strong advance from around $60,500.
Price later moved through several Fibonacci retracement levels before rebounding from lower support.
Bitcoin is now trading between the 0.618 and 0.786 Fibonacci retracement levels. The 0.618 level is near $82,884.
The 0.786 level is near $73,044. This range is being watched because price often reacts near these areas.
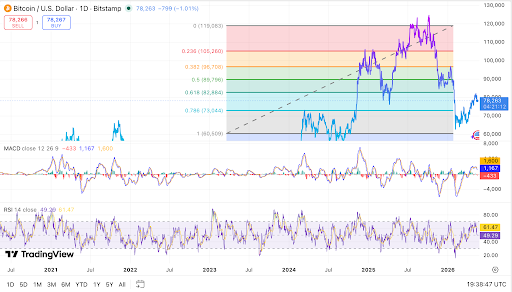 BTC price compresses near $78K as liquidity levels build. Source: TradingView
A daily close above $82,884 would place Bitcoin back above immediate resistance.
That move could support a push toward $89,796. The next wider upside areas sit near $92K and $98K. A rejection below $82,884 would keep the market under pressure.
It would also show that the recent bounce has not changed structure. The chart still shows lower highs after the peak.
Read Also:
Key BTC Levels Remain In Focus
On the upside, the main levels are $82,884, $89,796, $96,708, and $105,260. The $89,796 level marks the 0.5 Fibonacci retracement.
The $96,708 level marks the 0.382 retracement. Liquidity zones near $92K and $98K may become important if Bitcoin clears nearby resistance.
These areas sit above current prices. They may draw attention during a recovery attempt.
On the downside, the $73,044 level remains a major support area. Wider downside levels sit near $71K and $65K.
A daily close below $73,044 could open the way toward those zones.
Momentum readings remain mixed on the daily chart. The MACD line is near 1,164, while the signal line is near 1,600. The histogram is near minus 436, so momentum remains weak.
The RSI is near 49.17, which places it close to neutral. This reading does not show overbought or oversold conditions.
Bitcoin remains compressed near $80K, with liquidity building around $78K.
The post Bitcoin Liquidity Builds Near 78K As Price Compresses Around 80K appeared first on Live Bitcoin News.


Ayrıca Şunları da Beğenebilirsiniz

Why Bitcoin Price Could Be Forming A Consolidation Structure Around $80,000
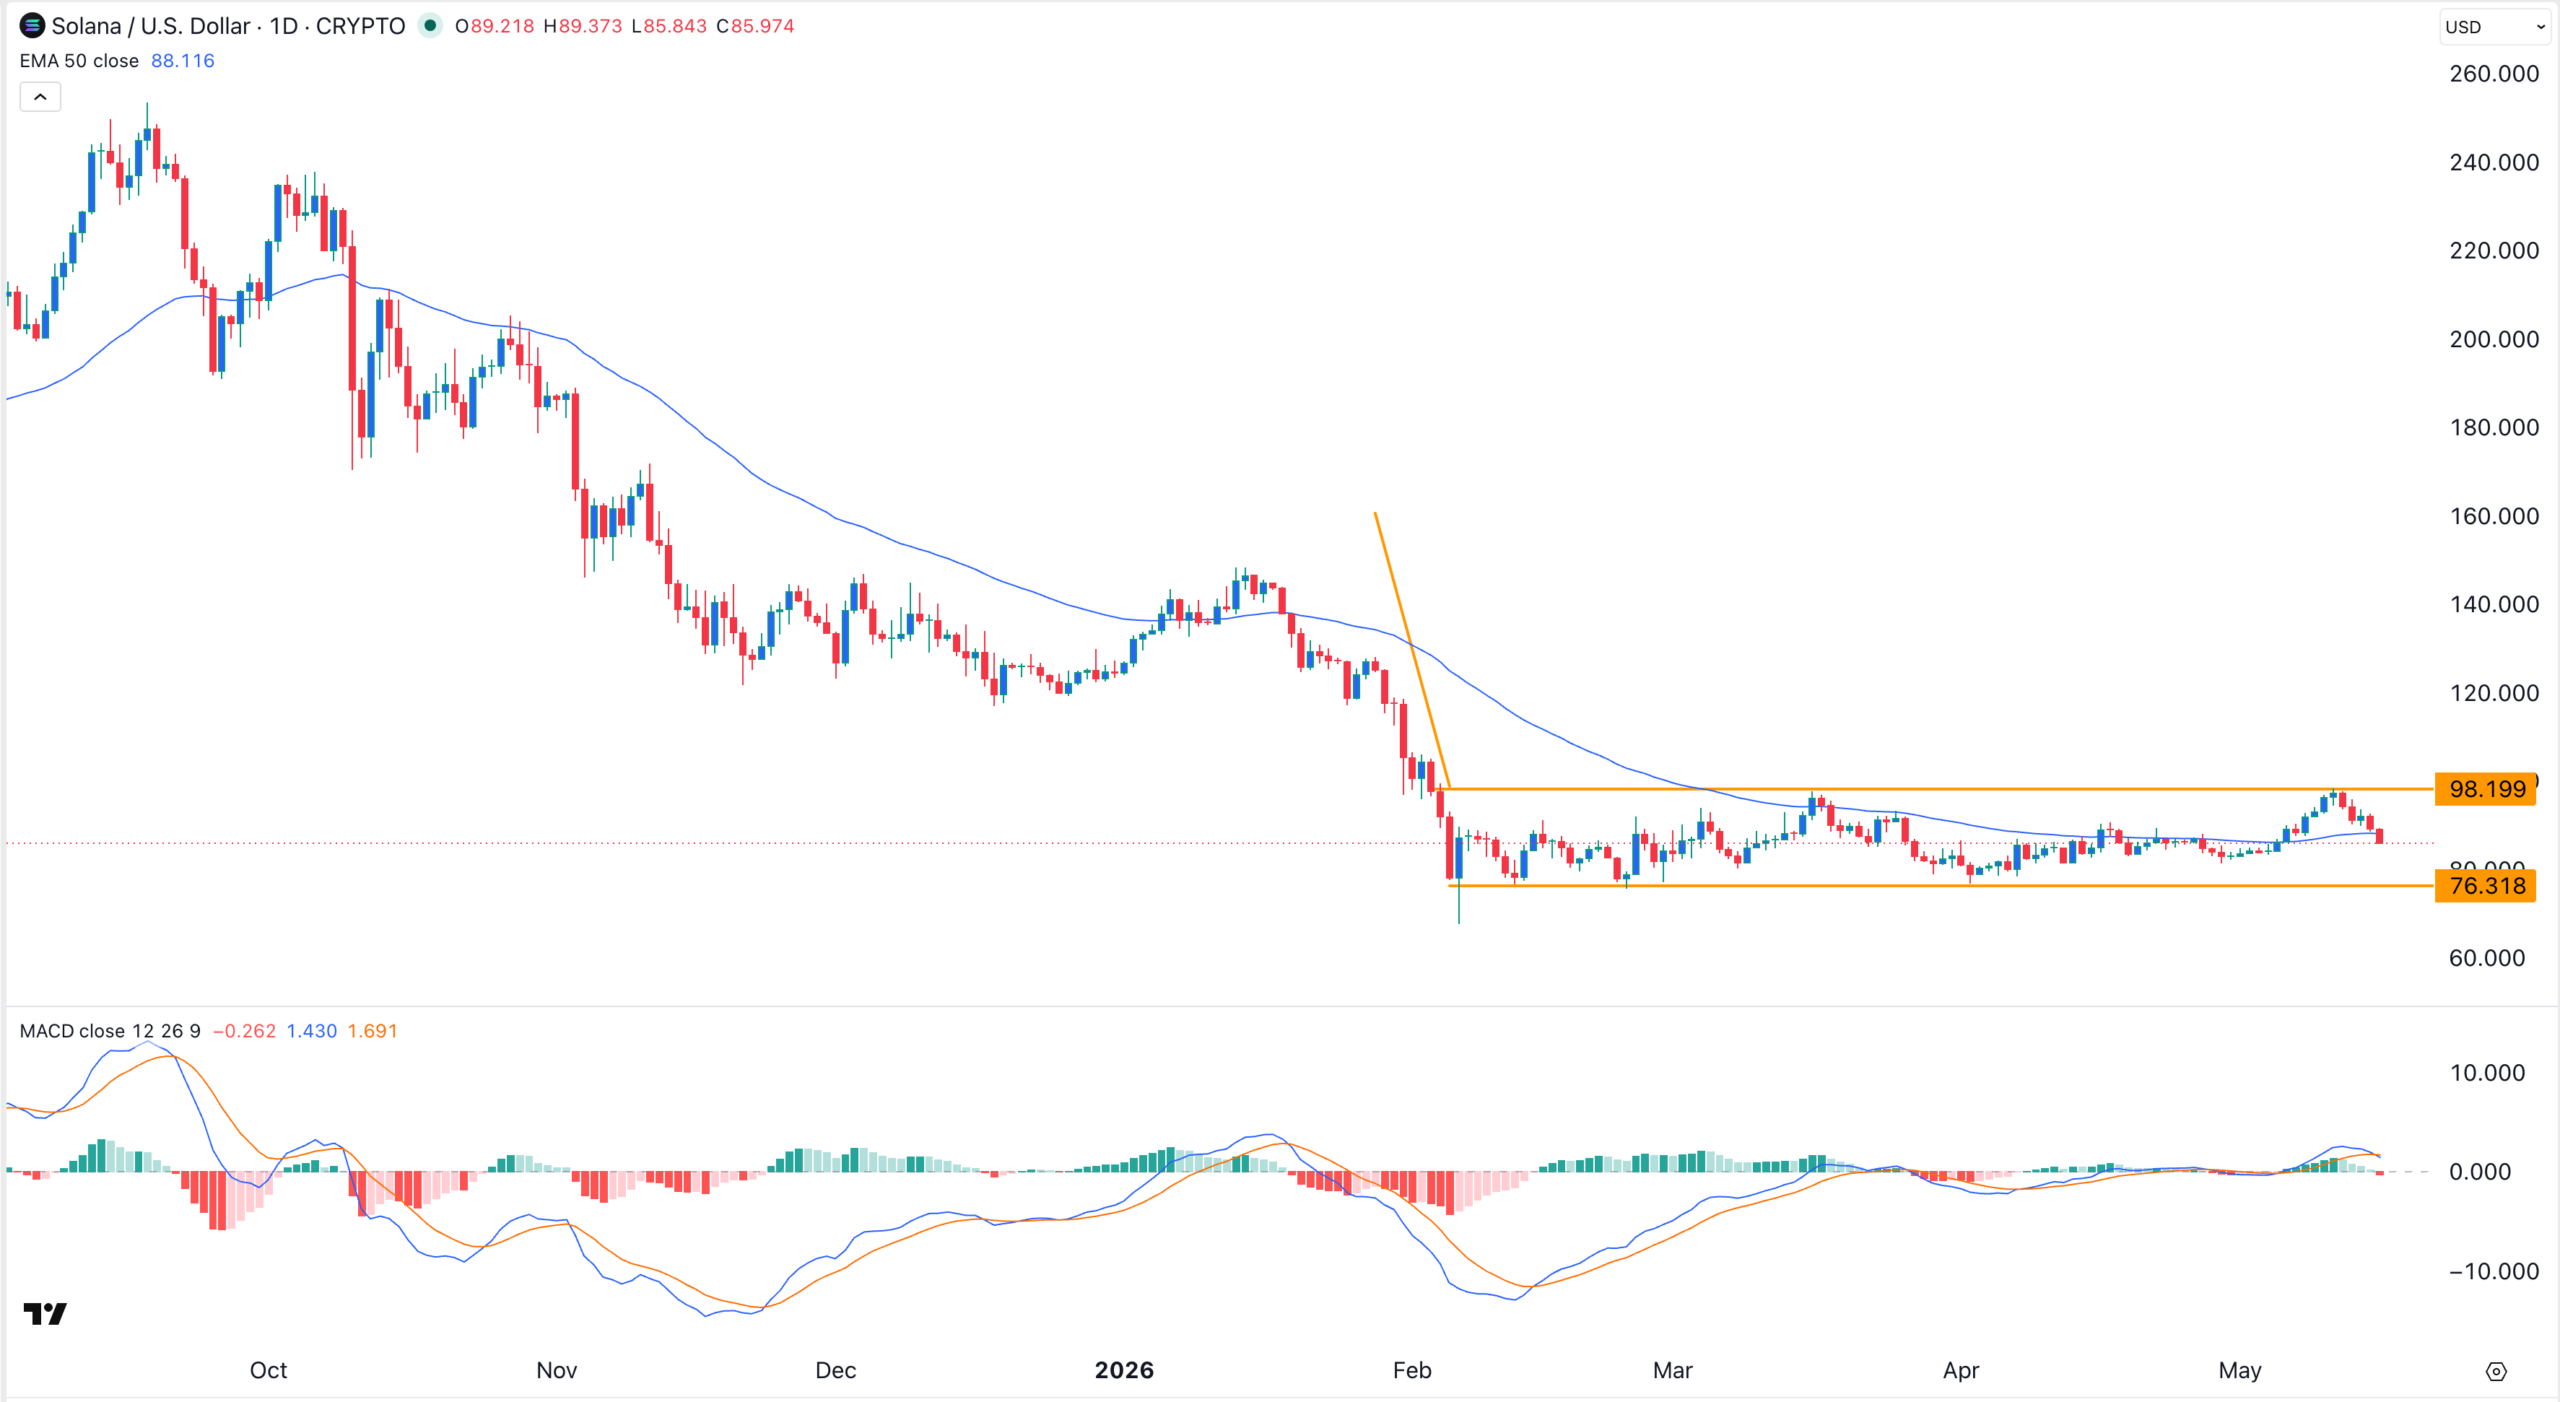
Solana Price is Hanging on a Thread as Crypto Fear and Greed Index Falls