Bitcoin Monthly Structure Signals Continuation Of Major Historical Trend
Bitcoin’s long-term price structure is once again drawing attention, as the asset continues to follow a powerful historical pattern on the monthly timeframe. Despite short-term volatility and shifting market sentiment, the broader trend suggests BTC may still be tracking well-established cyclical behavior from previous market phases.
How Historical Bitcoin Data Supports A Positive May Outlook
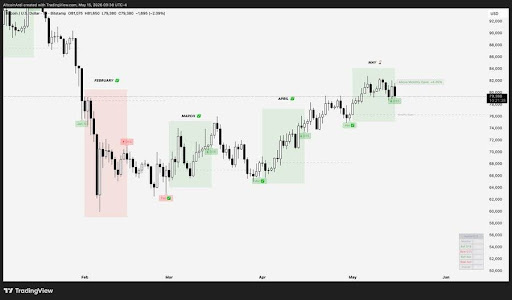
The Bitcoin monthly structure continues to follow a historically reliable pattern that may favor another strong close for May. Crypto trader Ardi has highlighted that as of Friday, BTC was trading roughly 5% above its monthly open, a positioning that has historically provided one of the strongest clues for how the rest of the month is likely to finish.
Data shows that when BTC is above its monthly open by the 15th, the market has historically closed the month in positive territory approximately 77% of the time. This trend provides a statistically significant edge, suggesting that May is likely to finish at or above its monthly open near $76,000, making a clean breakdown of the current range less probable in the short term.
This pattern has shown remarkable consistency over recent market cycles, with 11 of the last 13 months following the same trend. If May ultimately follows through, BTC would print three consecutive green monthly candles, which has never happened during any previous BTC bear market.
Bitcoin’s recent retest of key levels was initially successful, but BTC has now returned to the same region for another critical retest. Crypto investor Rekt Capital explained that this repeated consolidation suggests the retest process may continue through the remainder of the week as the market searches for confirmation on its next major directional move.
BTC needs to secure a weekly close above the 21-week Exponential Moving Average (EMA) green to maintain positioning for additional short-term upside momentum. However, on a broader timeframe, the outlook remains more cautious. As long as BTC continues to respect its multi-month pattern of lower highs, the macro bias leans bearish.
Why Trapped Shorts Could Fuel Bitcoin’s Next Move Higher
According to JDK Analysis, the recent downside move in Bitcoin was primarily driven by long liquidations rather than strong selling pressure. Spot market activity remained relatively muted, suggesting that the drop lacked real conviction from sellers and was instead a mechanical flush of overleveraged positions.
At the local bottom, the dynamics began to shift. Fresh short positions entered the market, but instead of pushing the price lower, they were met with passive buying interest that absorbed the selling pressure. As a result, many of these newly opened shorts are now trapped at the lows, creating the conditions for bullish absorption.
JDK Analysis noted that the key next step is whether aggressive buyers step in with conviction. If they do, price could begin to move higher, forcing those trapped shorts to cover their positions, which would add fuel to the upside and confirm strength.


Ayrıca Şunları da Beğenebilirsiniz

Iran’s foreign minister targeted in assassination attempt, wife killed

Bitcoin breaks critical support as dollar and oil move together, raising risk of a deeper drop