Bonk price trades below its 200 Daily MA with weakness: why price can trade lower
Bonk price continues to trade below its 200-day moving average, signaling weakness and the potential for a deeper correction if the current resistance zone remains intact in the short term.
- Bonk trades below the 200-day moving average and point of control resistance.
- Structural weakness suggests potential for further downside toward value area low.
- Reclaiming 200-day MA on strong volume is key for any bullish recovery.
After a sharp capitulation event, Bonk’s (BONK) price action remains under pressure as it struggles to reclaim the 200-day moving average. This level, which now aligns with the daily resistance at the point of control, has become a key structural barrier preventing any meaningful bullish recovery.
The failure to reclaim this dynamic resistance suggests that sellers still dominate the market, and until the structure shifts, the probability of further downside remains high.
Bonk price key technical points
- Major Resistance: 200-day moving average in confluence with the daily point of control.
- Major Support: Value area low and high-time-frame support below the current structure.
- Market Structure: Trading below the 200-day moving average confirms continued weakness and bearish control.
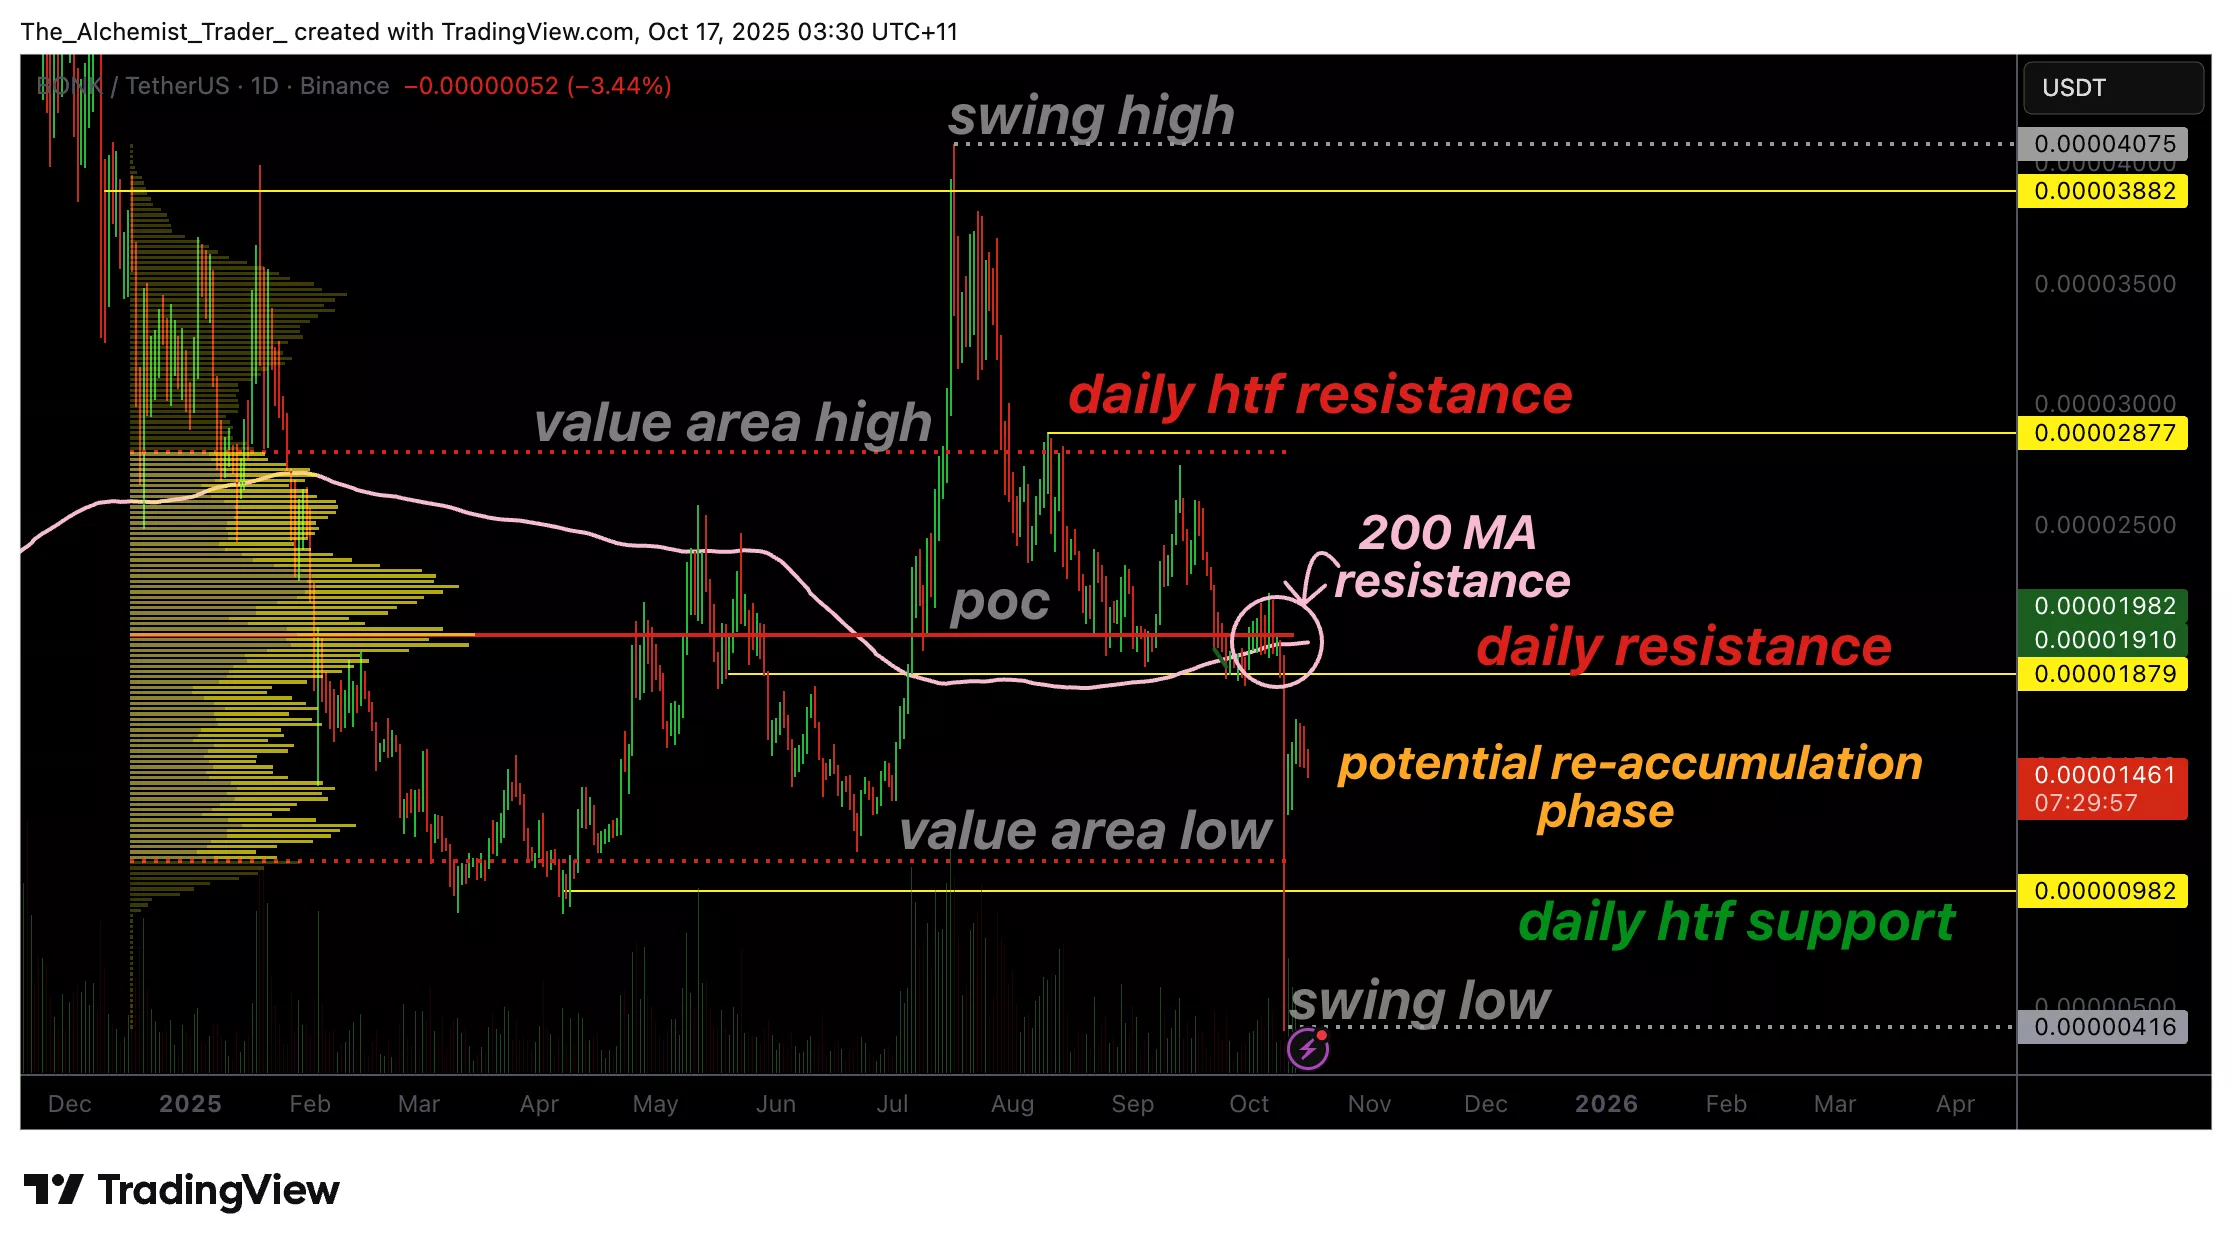
Bonk’s price currently trades below its 200-day moving average, a level that often separates bullish continuation from bearish decline. The confluence between this moving average and the daily resistance around the point of control creates a strong rejection cluster. Historically, such zones serve as heavy resistance areas where price action tends to stall or reverse without significant volume expansion.
Following the earlier capitulation move, price briefly attempted to reclaim this resistance but failed to maintain a daily close above it. Since then, every attempt to retest the 200-day moving average has resulted in rejection, signaling the persistence of bearish pressure. The structure now implies that, without a successful breakout and close above this region, the market remains vulnerable to further downside rotation.
The next area of interest lies near the value area low, which coincides with a daily high time frame support. This level represents the likely destination for price if weakness continues. A retest of this region may also establish a potential re-accumulation phase, where the market consolidates before deciding on the next major directional move.
However, for a bullish reversal to take form, Bonk must reclaim the 200-day moving average and close decisively above the daily resistance. Doing so would signal a structural shift and open the probability for an upward rotation toward higher targets.
What to expect in the coming price action
As long as Bonk remains below the 200-day moving average, the probability of a deeper move toward the value area low remains elevated. Sustained trading below this level will likely result in a prolonged consolidation or re-accumulation phase before any new rally can develop.
Conversely, a strong daily close above the 200-day moving average would invalidate this bearish outlook and confirm renewed bullish intent.


Ayrıca Şunları da Beğenebilirsiniz

Dexa AI Taps Vector AI to Accelerate Web3-Based Market Intelligence

Samsung One UI 9 beta is here: What Galaxy users should know