

Shiba Inu Price Prediction: Analyst Sees SHIB Bullish Reversal After Major Support Holds
Key highlights:
- The SHIB price is testing a major long-term support after losing over 95% since its all-time high
- Daily and 4-hour charts remain weak as SHIB trades below the 100-day SMA
- Shibarium upgrades and 781 billion SHIB leaving exchanges give traders more to watch
Shiba Inu has arrived at a very significant level on its long-term chart. Having lost more than 95% of its value from the highs of 2021, the SHIB price is now trading in a support region that many people feel may determine its future course.
According to crypto analyst SHIBMortal, the monthly chart shows that SHIB is still within an important accumulation region. This has reignited discussions on whether this is a sign of recovery or just another consolidation before the continued downtrend.
The SHIB price is testing a key monthly support zone
The monthly chart clearly depicts how hard the past several years have been for holders of Shiba Inu. SHIB recorded its all-time-high level of $0.000088359 in the bull market of 2021. Following that, the SHIB price has declined to $0.00000420, putting it about 95.2% lower than that all-time-high.
Despite such a fall, there is one particular area which has managed to capture attention according to the monthly chart. So far, the support zone of roughly $0.00000400-$0.00000420 has held out, and the current monthly candle continues trading within that range.
According to SHIBMortal, the area might represent an accumulation zone where investors continue slowly returning to the market. Assuming that the support will keep being intact, the first upside target on the chart is estimated at $0.00002040. Higher on the price range, resistance zones are identified at $0.00004040, $0.00006040 and $0.00008040.
The zones are located rather far away from the current price, while the token would first need to prove its ability to hold the support before any rise towards them becomes likely. Otherwise, according to the monthly chart, SHIB has no historical support up to about $0.00000200.
The SHIB price is testing critical technical levels
We analysed the SHIB daily chart and the overall trend continues to be bearish. The current price level stands at $0.00000424, down from $0.00018000 reached in late 2025. This represents that SHIB is down by 97.6% from its high as indicated on the chart.
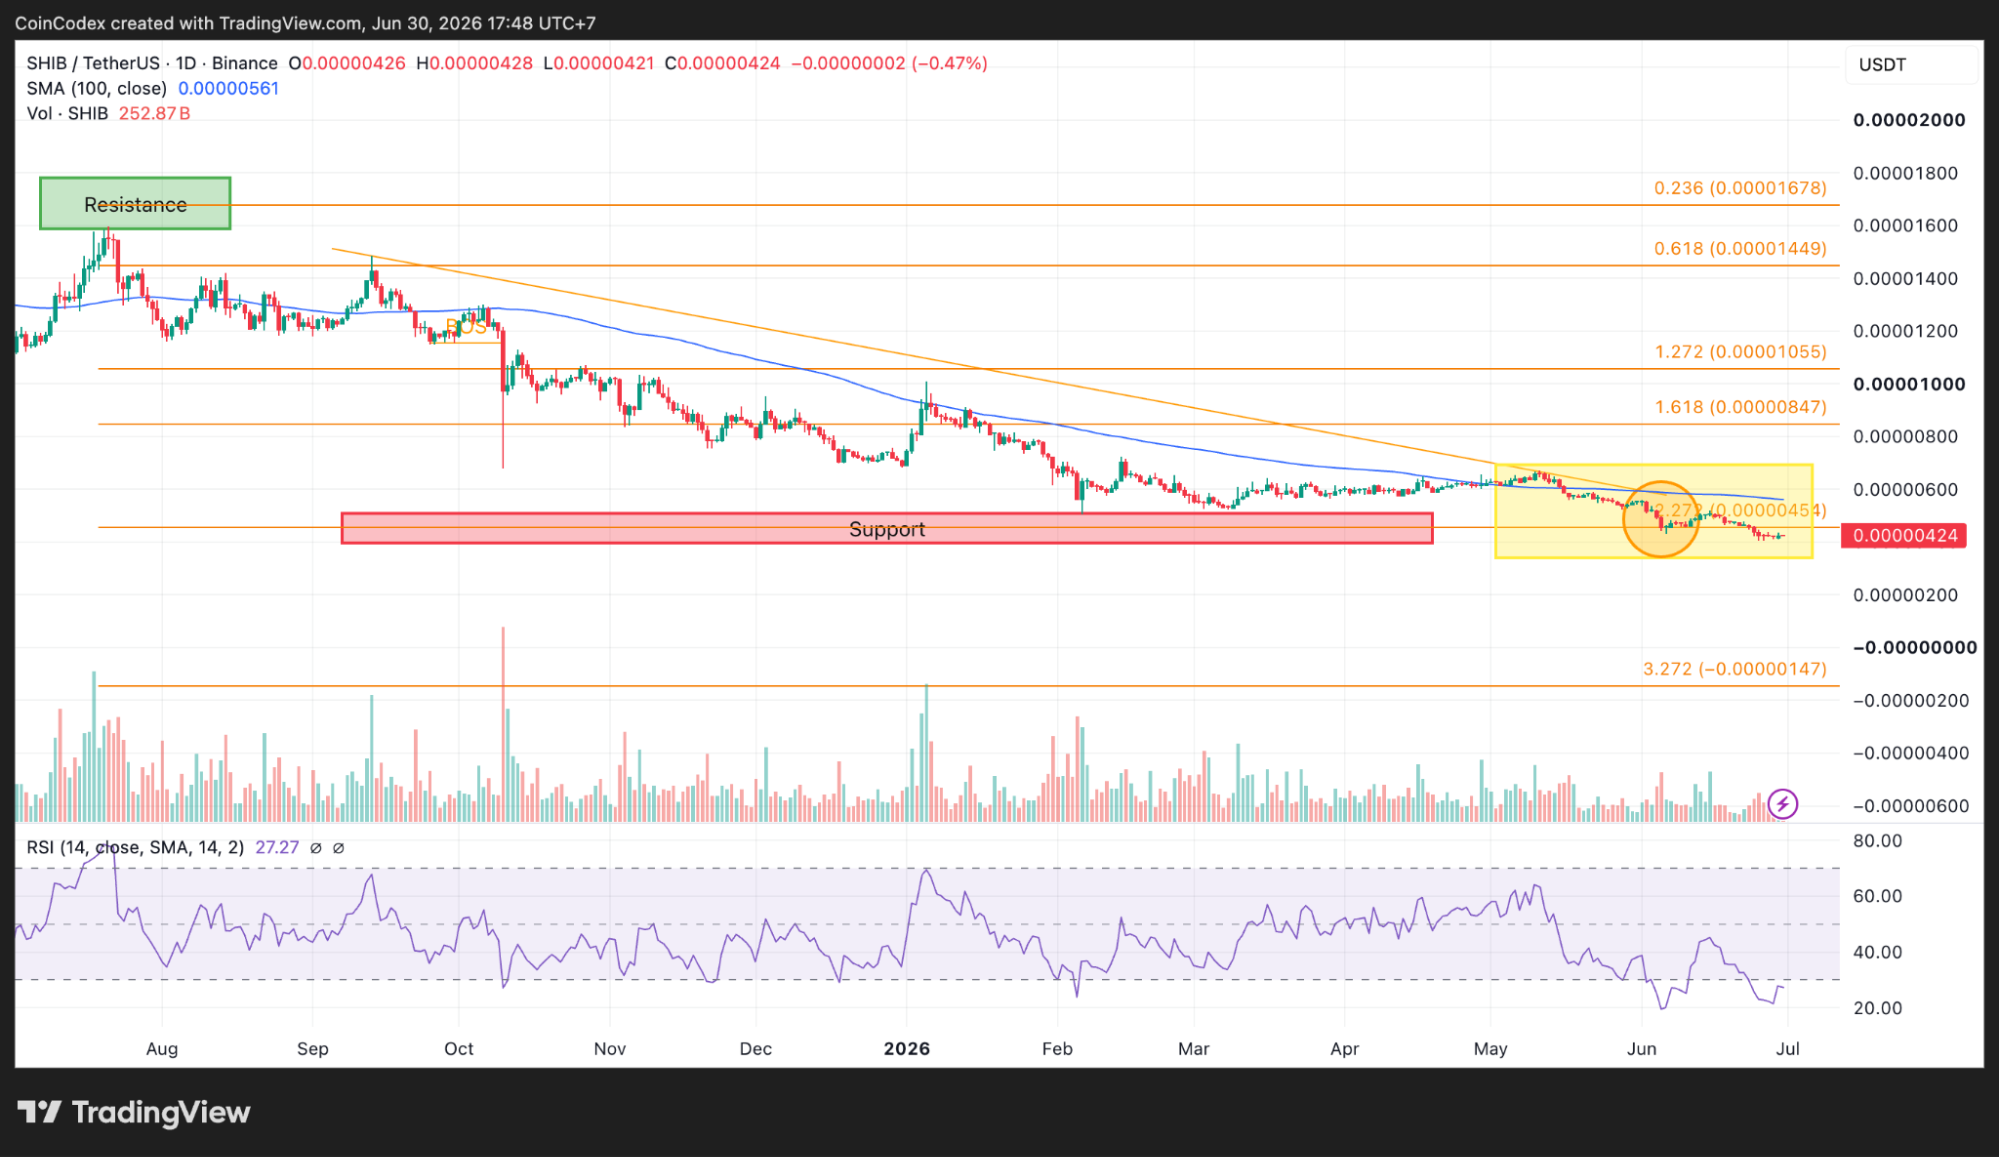
Daily SHIB chart analysis
The 100-day simple moving average is sitting near $0.00000561. The SHIB price remains about 24.4% below that level, and the moving average itself continues moving lower. That usually shows sellers still have control of the larger trend.
Attempts to rebound have taken place in 2026 on two occasions. The first one was recorded in March when SHIB moved from $0.00006000 to $0.00012000. In April, another recovery was experienced, where the SHIB price moved from $0.00004000 to $0.00008000. Neither move lasted long enough to change the trend.
We also reviewed the 4-hour chart, where price has settled into a very tight range between roughly $0.00000421 and $0.00000426. The 4-hour RSI is trading at 48.53 and near to the 50 neutral mark, indicating that momentum is not significantly oversold and indicating balance between buyers and sellers in the short run.
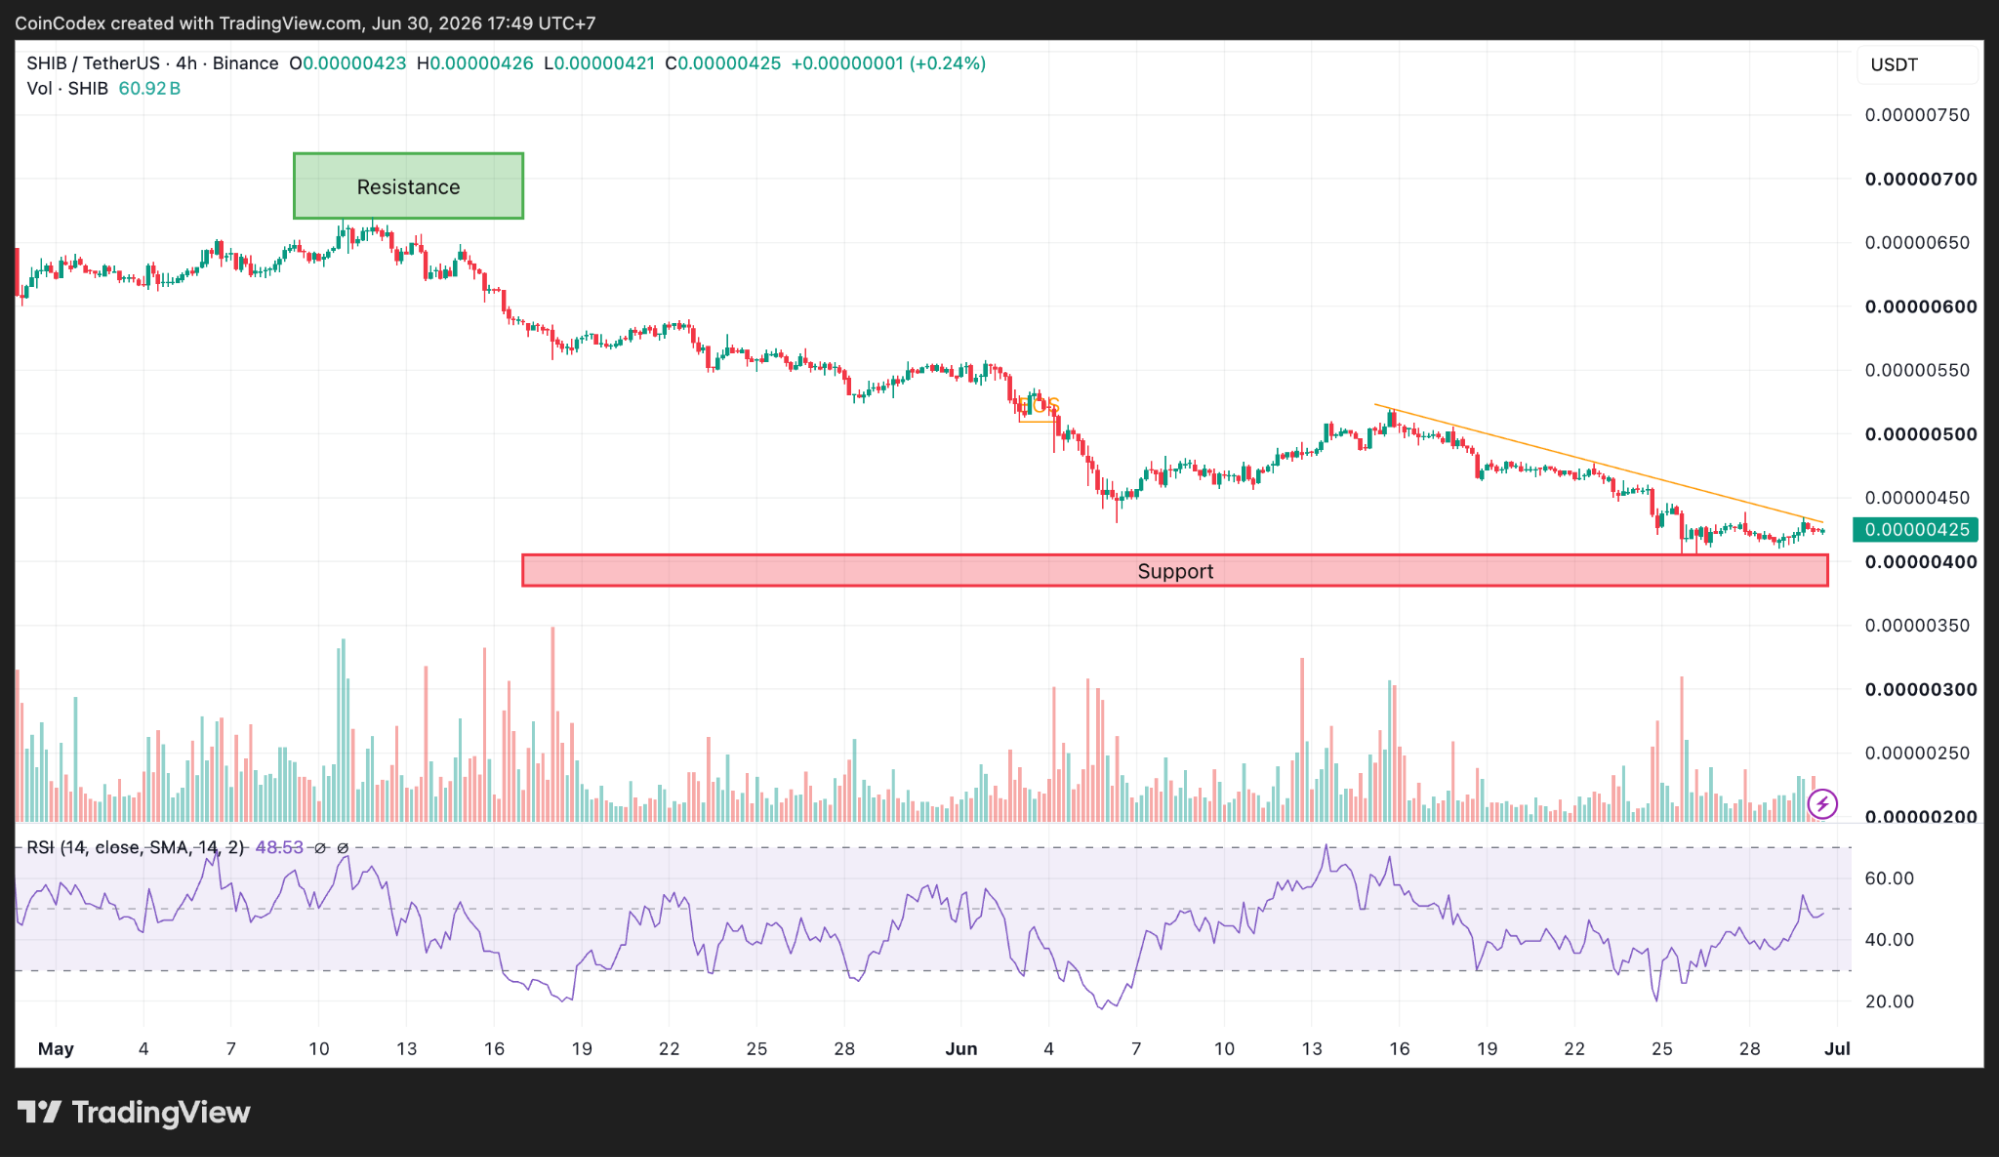
4-hour SHIB chart analysis
First resistance is at $0.00000450, but above it, the resistance at $0.00000500 is being awaited before traders refocus on the 100-day moving average of $0.00000561. The support level stays at $0.00000421. Losing that level could open the door toward $0.00000400 and possibly lower.
SHIB on-chain activity remains stable
Network activity offers another piece of the puzzle. Transfer activity has stayed around 3,000 transactions per day during the observed period. That number has remained fairly steady even though the SHIB price has continued moving lower.
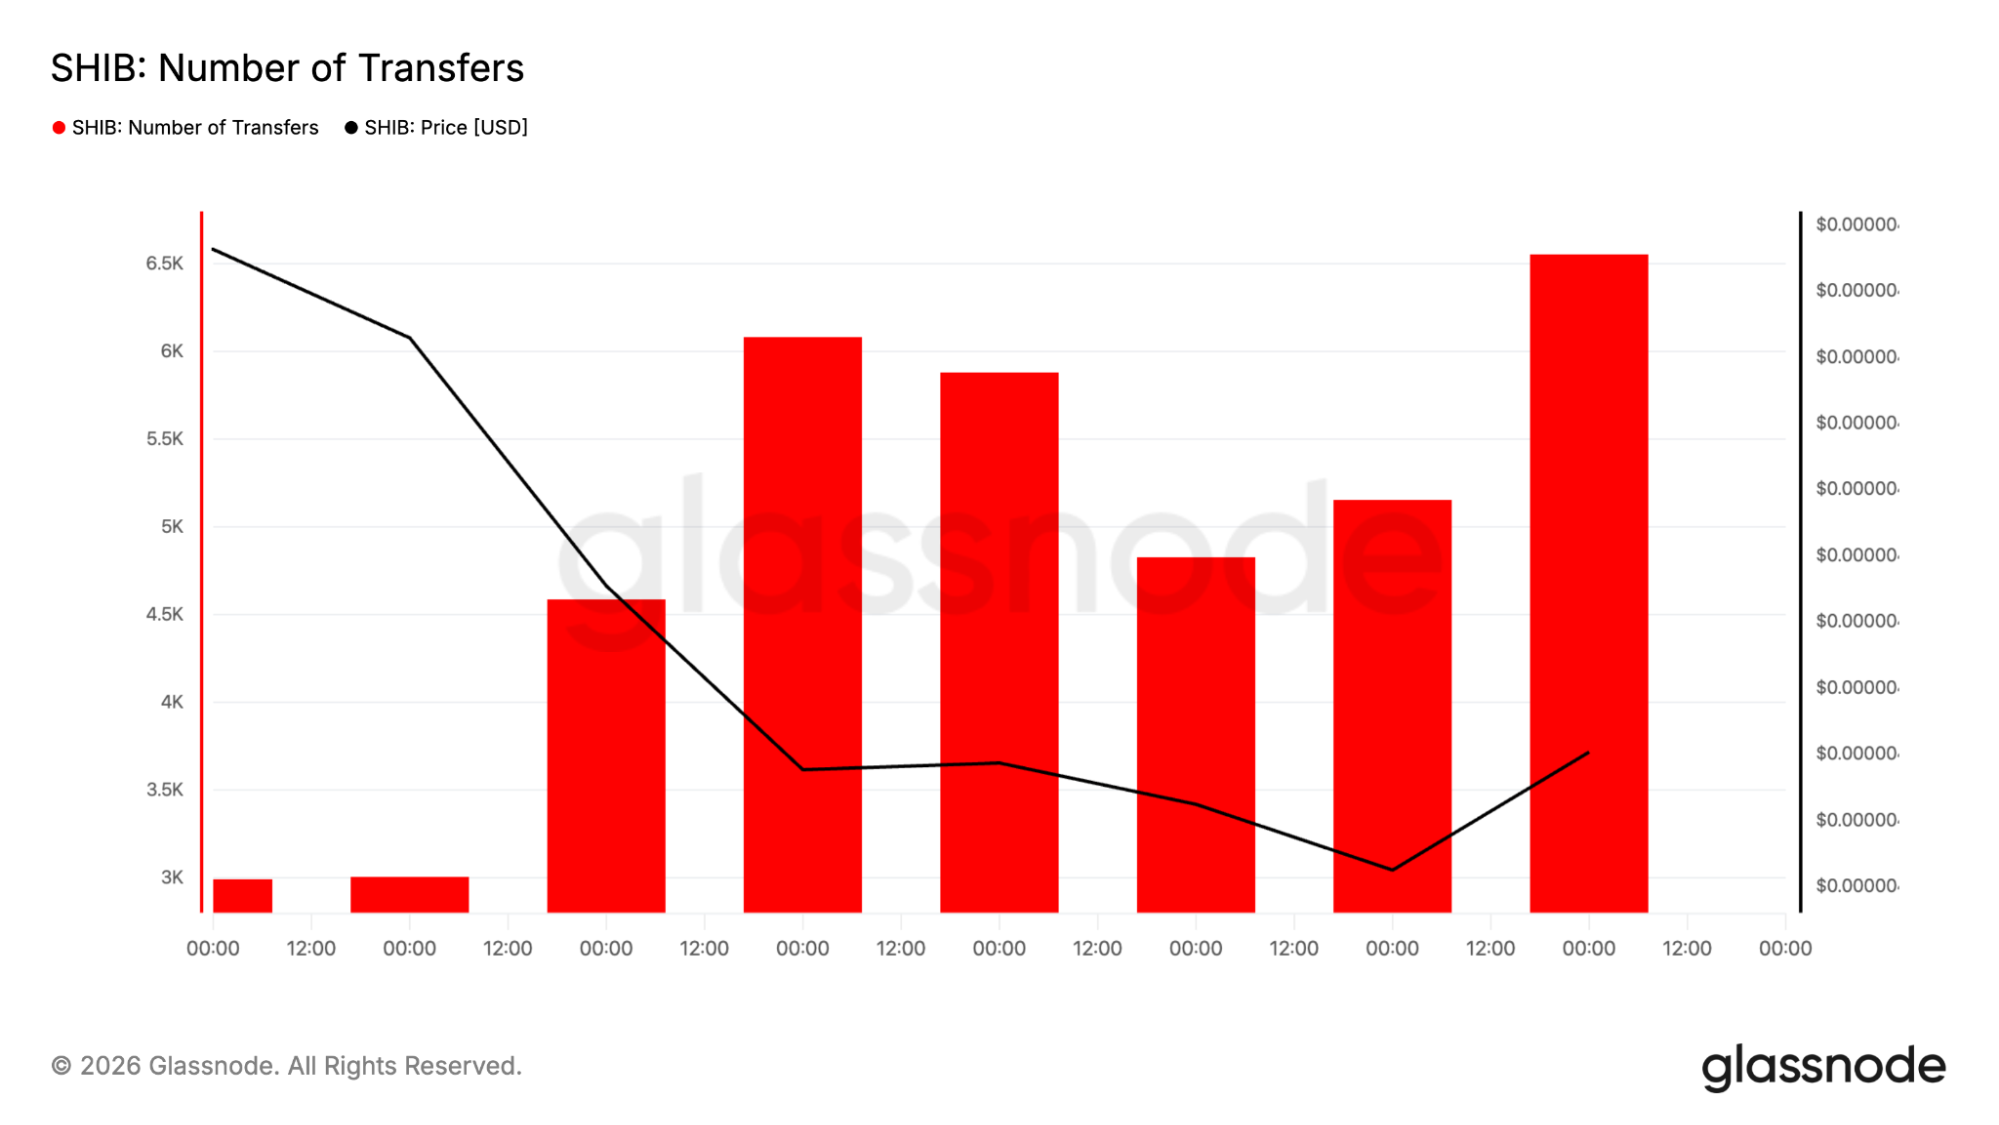
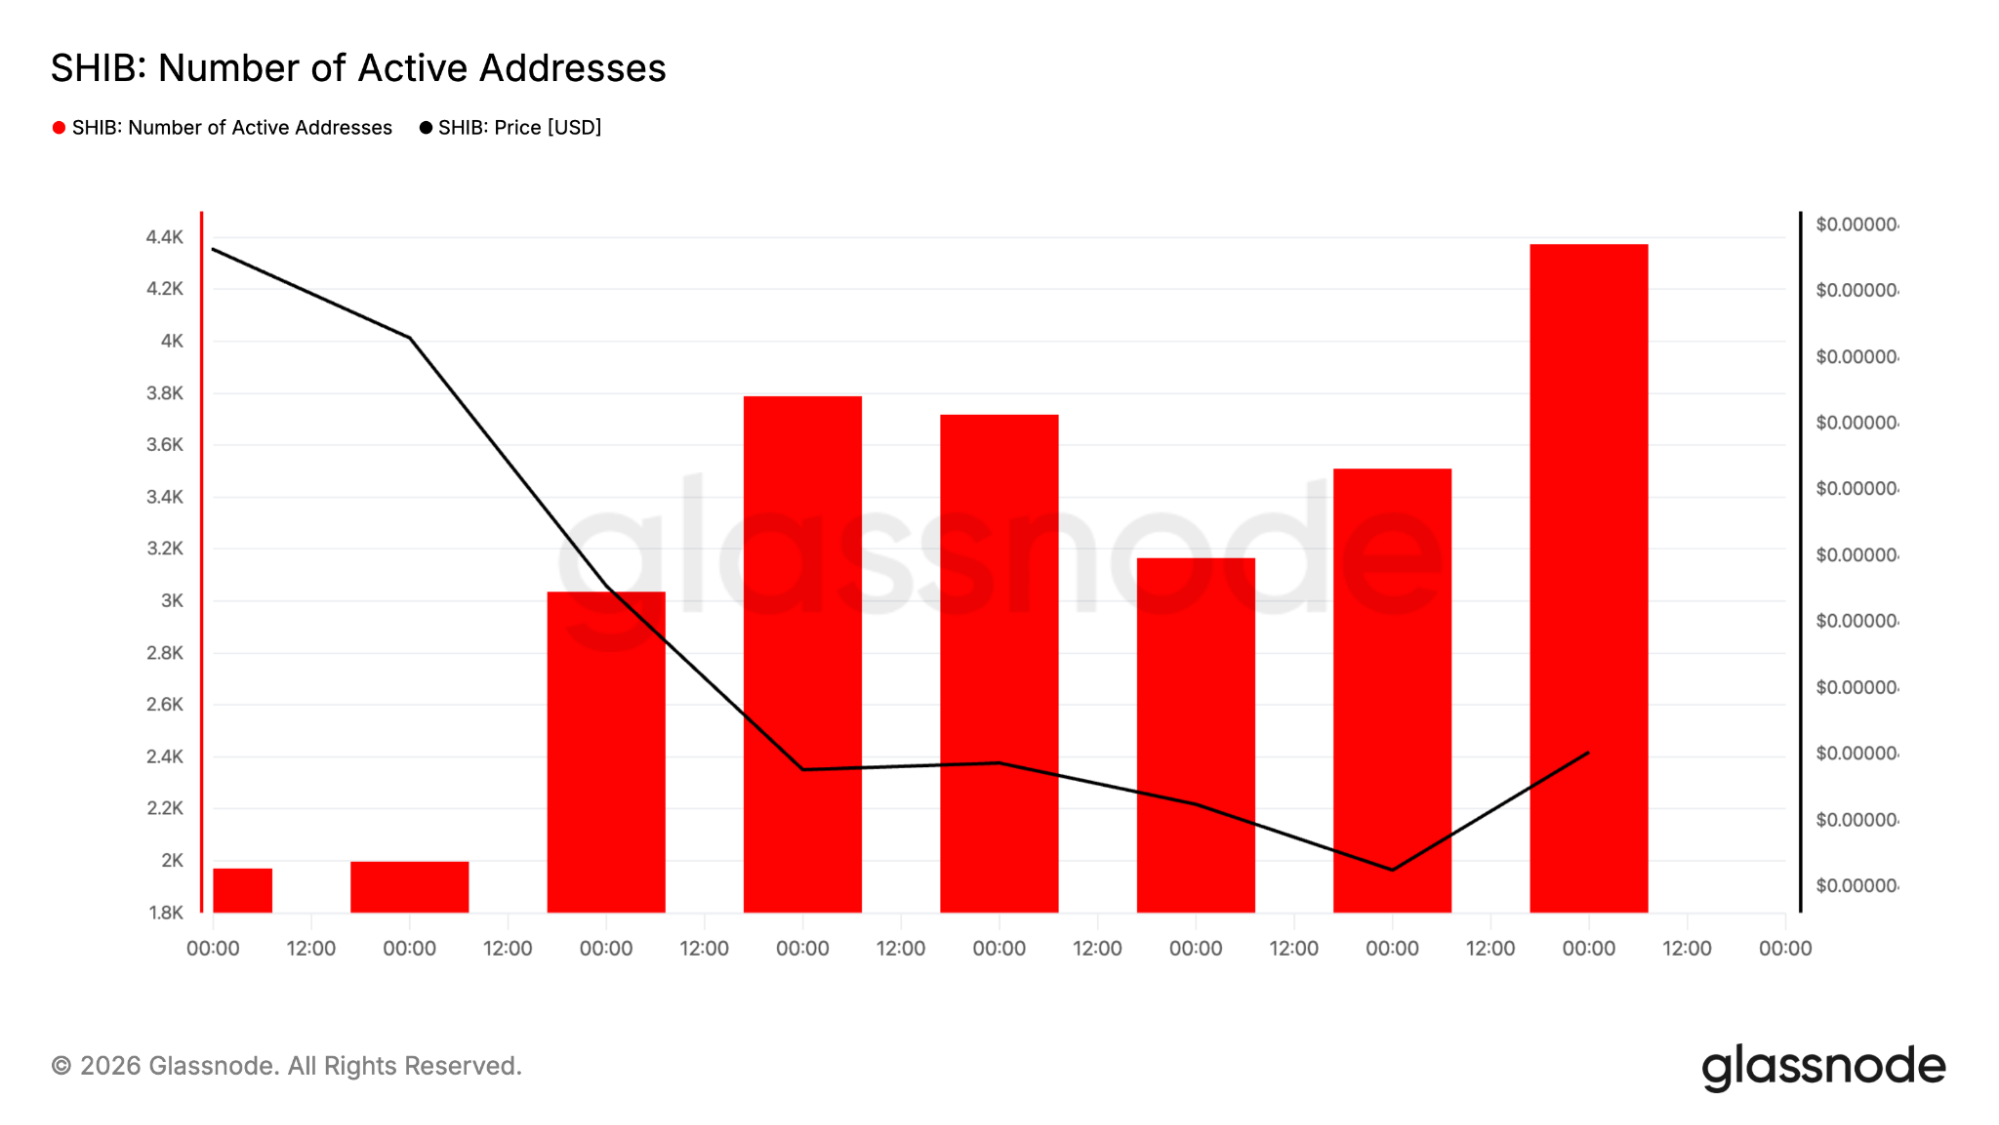
The available active address dataset contains obvious inconsistencies, making it unreliable for analysis. Transfer activity provides a much cleaner picture, showing the network is still being used even though adoption has not accelerated.
Stable transaction numbers mean existing users remain active, but they also show that blockchain activity has not grown enough to support a stronger recovery in price.
Shibarium keeps expanding as institutions begin paying attention
Development inside the ecosystem has continued despite the weak market. The Shiba Inu team is still expanding Shibarium through upgrades like the Shib Alpha Layer, which is designed to improve transaction processing, simplify RollApp integration and support more flexible gas payments.
Automatic burn features and artificial intelligence initiatives also remain part of the roadmap.
SHIB was labeled as a digital asset by the SEC in March 2026, allowing for inclusion in T. Rowe Price's proposed Active Crypto ETF. However, it has not led to an immediate rally; rather, it provides more regulation for institutional investors in case of future demand.
The behavior of whales has also changed since SHIB is no longer popular. In the period from June 25 to June 29, about 781 billion SHIB moved from centralized exchanges. Less SHIB on the exchanges makes it easier to avoid selling, since there are fewer tokens that can be sold.
Can the SHIB price finally turn around?
The SHIB price has reached one of the biggest technical tests it has faced in years. The monthly support zone is still holding. The daily RSI remains deeply oversold, and bullish divergence continues to appear across higher timeframes. Those signals show downward momentum is slowing.
The broader trend, however, still belongs to sellers. The SHIB price remains well below its falling 100-day moving average, and every rally this year has stopped before reaching major resistance.
At the same time, Shibarium continues expanding, institutional access has improved, and exchange balances have fallen following large whale withdrawals. Those developments improve the long-term picture, but the chart still needs buyers to reclaim higher levels before a recovery can be confirmed.
According to CoinCodex's 1-month SHIB price prediction, the SHIB price could reach $0.000004245, pointing to limited upside from current the level if buyers continue defending support around $0.00000421 and generate enough momentum to reclaim resistance near the 100-day SMA at $0.00000561.


You May Also Like

Q2 Market Insights: Bitcoin regains dominance in risk-averse environment, ETFs remain critical to market structure

Moody’s Assigns First-Ever Rating to Bitcoin-Backed Municipal Bond in Historic Crypto Finance Move


