Broadcom Stock Slides Below Key EMAs — But JPMorgan Sees $580
Broadcom stock is trapped between bearish technicals and a powerful AI narrative. AVGO trades near $369.48, below key moving averages, with daily momentum deteriorating. Still, fresh institutional backing and a custom AI chip milestone keep the longer-term bullish case intact.
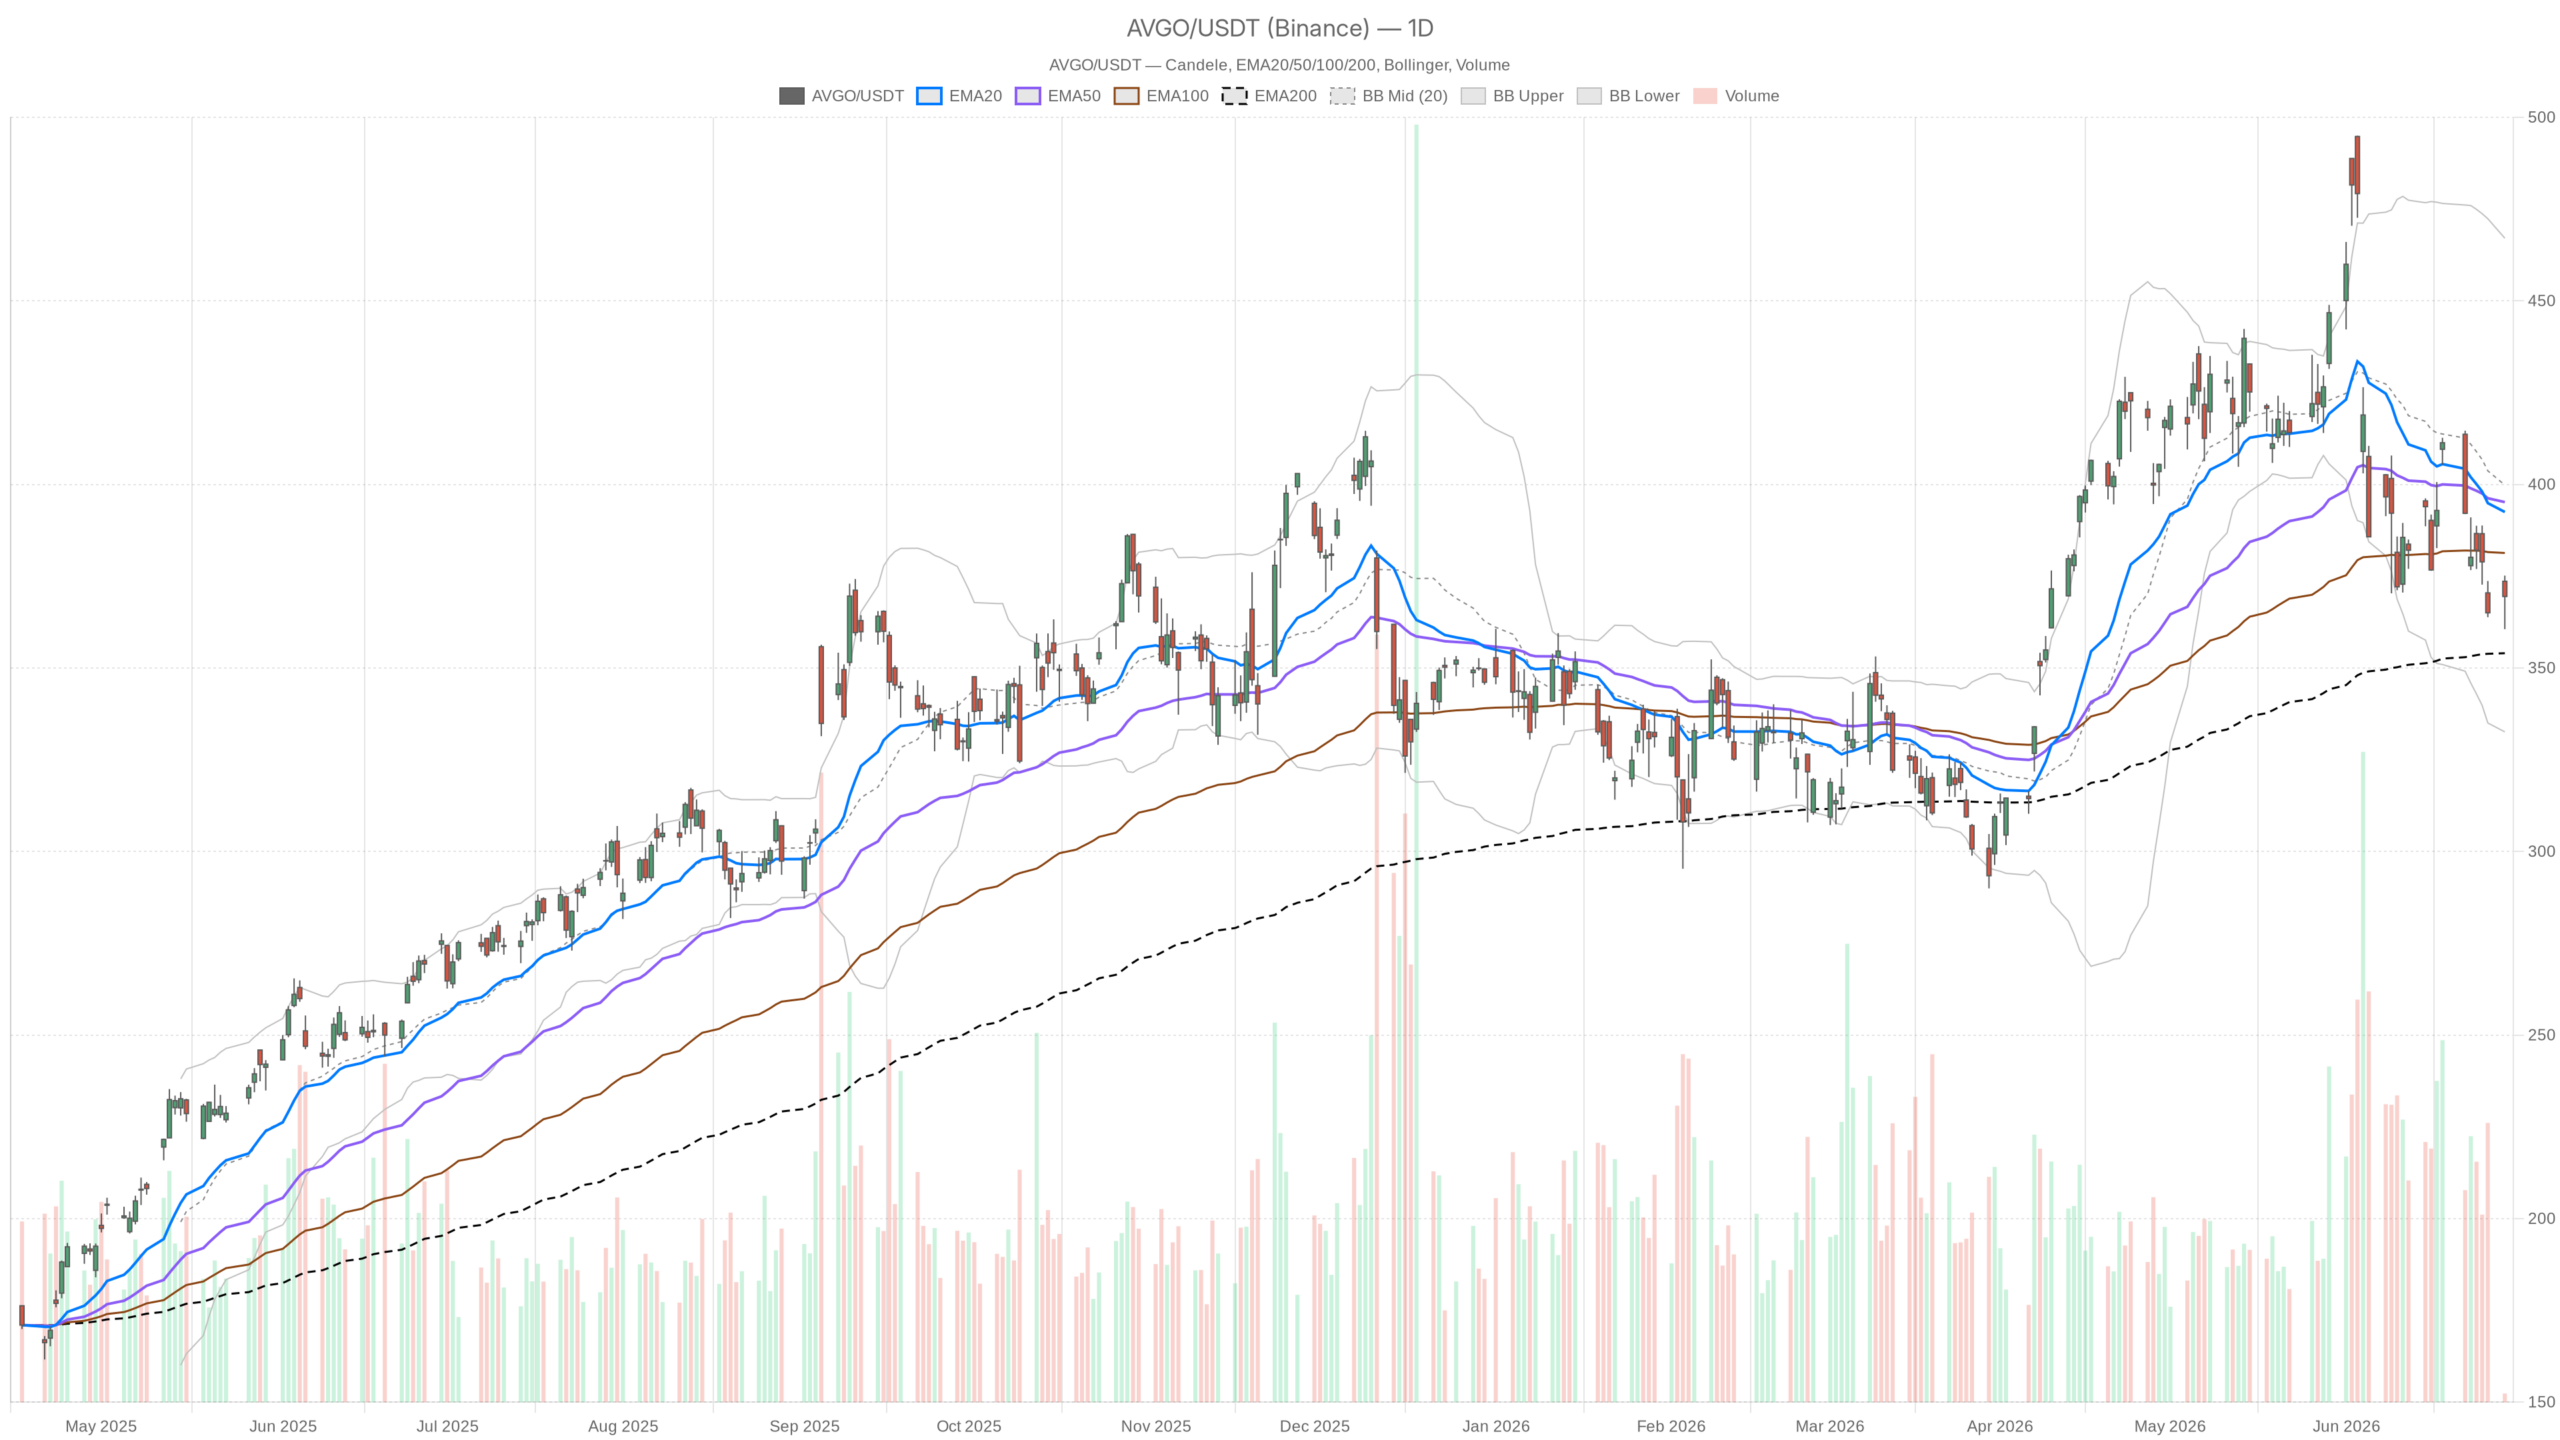 AVGO — daily chart with candlesticks, EMA20/EMA50 and volume.
Key takeaways
- Broadcom stock trades at $369.48, below both its 20-day EMA ($392.48) and 50-day EMA ($395.18).
- Daily MACD sits at -10.86 with a widening negative histogram of -3.26, signaling active momentum deterioration.
- The 200-day EMA at $354.02 serves as the critical structural floor for the bullish thesis.
- JPMorgan reiterated an Overweight rating with a $580 price target, confirming the TPU v9 program remains on schedule.
- Billionaire Stanley Druckenmiller initiated a 196,000-share position in Q1 2026, rotating out of Nvidia and into AVGO.
Daily Technical Picture: Bears Hold Broadcom Stock in Check
The daily chart for Broadcom stock is firmly bearish. Price is trading beneath both the 20-day EMA at $392.48 and the 50-day EMA at $395.18. This confirms the intermediate trend has turned against the bulls. The daily MACD reinforces that view. The line sits at -10.86, well below the signal at -7.60. Meanwhile, the histogram continues to widen negatively at -3.26.
Momentum is not merely weak. It is actively deteriorating. The RSI at 41.44 sits in weak territory without yet reaching oversold conditions. No technical floor signals imminent exhaustion of selling pressure. In short, the daily structure offers little comfort to buyers.
Where Broadcom Stock Could Find Support
Broadcom stock has meaningful structural support at the 200-day EMA of $354.02. This level remains untested despite the ongoing downtrend. The daily Bollinger Bands show a lower band at $332.59 and a midline at $399.83. Price hovering near $369 sits in the lower half of the band. This is consistent with a downtrend but not yet at extreme compression.
Notably, the daily ATR stands at $18.37, reflecting elevated volatility. Single sessions can produce large swings in either direction. Pivot analysis adds further texture. The pivot point sits at $368.40, with R1 at $376.23 and S1 at $361.64. AVGO is oscillating right around the pivot — a zone of indecision rather than conviction. A clean reclaim of $376 would shift the short-term tone. Conversely, a break below $361.64 opens the path toward the $354 EMA200 support.
Lower Timeframes Confirm Bearish Pressure
The shorter timeframes reinforce the bearish bias rather than softening it. Selling pressure extends across the hourly chart, while only the 15-minute frame offers a faint hint of stabilization.
Hourly Chart Extends the Sell Signal
The hourly regime is explicitly classified as bearish. Price trades below the 20-hour EMA at $374.49, the 50-hour EMA at $381.97, and the 200-hour EMA at $400.49. This is a full stack of moving averages pressing down on current price. The hourly MACD line at -5.19 remains below its signal at -4.76. The histogram is marginally negative at -0.42, suggesting some deceleration in selling but no reversal. Hourly RSI at 40.09 mirrors the daily read: weak but not washed out.
15-Minute Frame Hints at Stabilization
By contrast, the 15-minute chart introduces a mild counterpoint. The 15m MACD histogram has flipped positive to +0.48. RSI has recovered to 49.19 — essentially neutral. Price sits just above the 15m EMA20 at $369.39. This short-term stabilization matters only as execution context. It suggests the immediate tape is catching its breath, not reversing trend. Intraday traders may see micro bounces around $369–$370. This does not challenge the directional bias established on higher timeframes.
AI Catalysts Strengthen the Fundamental Case
The fundamental picture for Broadcom stock is notably more constructive than the technical one. JPMorgan reiterated its Overweight rating with a $580 price target on June 17. Analyst Harlan Sur directly pushed back against market fears of delays in Broadcom’s TPU v9 program with Google. He confirmed the program is on schedule. This is a key catalyst for the AI custom silicon revenue story.
At the same time, Broadcom and OpenAI released their first jointly developed custom AI chip. The Jalapeño chip marks a significant commercial milestone. CEO Hock Tan has also signaled a pivot away from acquisitions. He is choosing instead to accelerate organic AI development. That strategic clarity tends to reduce execution risk in the eyes of institutional investors.
Institutional Money Bets on Broadcom Stock
The smart money is taking notice of Broadcom stock. Billionaire Stanley Druckenmiller initiated a fresh 196,000-share position in Q1 2026. He rotated out of Nvidia and into AVGO. That kind of conviction from a macro investor of his caliber is not noise. It reflects a thesis built around AI infrastructure spending, custom chip economics, and Broadcom’s expanding role as a critical supplier to hyperscalers.
Two Scenarios for Broadcom Stock
Two distinct paths lie ahead for Broadcom stock. The bullish case hinges on structural support holding. The bearish case gains traction if key levels fail on a closing basis.
Bullish Scenario
The bullish case rests on the $354 EMA200 holding as structural support. Broadcom stock would base-build in the $355–$375 zone before staging a recovery toward $395–$400. A reclaim of the daily 20 EMA at $392.48 would constitute a genuine technical reversal signal. Confirmation of the TPU v9 timeline could close the gap between price and fundamental valuation. Further AI chip partnership announcements or any broader semiconductor rally would amplify upside momentum.
Bearish Scenario
The bearish case gains credibility if AVGO fails to defend the current pivot zone. A daily close below the $361.64 S1 level would expose the EMA200 at $354.02. From there, the lower Bollinger Band region near $332.59 comes into play. Broader market weakness in semiconductors could amplify selling pressure across the sector. If Nvidia or Micron disappoint, the AI narrative — however compelling — would struggle to offset technical deterioration.
Overall, Broadcom stock sits at a technically precarious level despite strong fundamentals. The daily bias remains bearish. The hourly structure confirms it. Only the 15-minute frame shows any hint of stabilization. The EMA200 at $354 is the line in the sand for the bullish thesis. Until AVGO reclaims its daily moving averages, the burden of proof rests squarely on the bulls — even as the AI story continues to build beneath the surface.
FAQ
What is the current technical outlook for Broadcom stock?
The daily technical picture for Broadcom stock is bearish. AVGO trades at $369.48, below its 20-day EMA ($392.48) and 50-day EMA ($395.18). The daily MACD sits at -10.86 with a widening negative histogram. RSI at 41.44 is weak but not yet oversold. The 200-day EMA at $354.02 remains the critical structural support.
What are the key support levels for AVGO?
The immediate support lies at the daily pivot S1 level of $361.64. Below that, the 200-day EMA at $354.02 serves as the critical structural floor. Further down, the daily Bollinger Band lower boundary at $332.59 represents the next significant support zone.
What AI catalysts could drive Broadcom stock higher?
Several AI catalysts are in play. The TPU v9 program with Google remains on schedule, as confirmed by JPMorgan. Broadcom and OpenAI jointly released the Jalapeño custom AI chip. CEO Hock Tan is pivoting toward organic AI development. These factors support the long-term bullish thesis, even as near-term technicals remain under pressure.
What is the bearish scenario for Broadcom stock?
A daily close below $361.64 would expose the 200-day EMA at $354.02 and potentially the lower Bollinger Band near $332.59. Broader semiconductor weakness — particularly from Nvidia or Micron — could amplify selling pressure. In that environment, the AI narrative would struggle to offset technical deterioration.
Disclaimer: This article is for informational purposes only and does not constitute financial advice, an investment recommendation, or a solicitation to buy or sell any financial instrument or cryptocurrency. The analysis provided is not indicative of future results. Investing in crypto assets and financial markets carries a high risk of capital loss. Always do your own research (DYOR) and consult a qualified financial advisor before making any decision.
Article produced with the assistance of artificial intelligence and reviewed by the editorial team.


You May Also Like

Riot Platforms Deposits 500 BTC in Suspected Sell-Off as Miner Activity Intensifies

Pacquiao insists Mayweather fight for real, shuns exhibition insinuation