

Bitcoin reclaims $65K as oil falls to a two-month low, more gains ahead or a dead cat bounce?
Bitcoin has reclaimed $65,000 after oil prices plunged to a two-month low following a reported US-Iran peace agreement that eased concerns over disruptions in the Strait of Hormuz.
- Bitcoin has climbed nearly 10% from its June low as oil prices hit a two-month low following reports of a US-Iran peace agreement.
- Technical charts show resistance near $67,500, with liquidation data suggesting a breakout could trigger further gains toward $75,000.
- Weak spot Bitcoin ETF demand remains a key risk after roughly $5 billion in net outflows since mid-May.
According to data from crypto.news, Bitcoin (BTC) climbed to an intraday high of roughly $65,995 on June 15, extending its rebound from the June 6 low near $60,000. The move represents a gain of about 10%, though Bitcoin remains roughly 21% below the local peak near $82,800 reached in May before the early-June selloff.
Bitcoin’s rebound today came as risk assets rallied across global markets after reports that Washington and Tehran had reached an agreement to end hostilities and restore oil shipments through the Persian Gulf. Crude oil fell more than 5% to around $80 per barrel, while equity markets surged across Asia.
Japan’s Nikkei 225 jumped 5.5%, South Korea’s Kospi gained as much as 5.7%, Taiwan’s Taiex rose 2.7%, and Australia’s ASX 200 added roughly 1.5%. U.S. stock futures also advanced, with S&P 500 and Nasdaq futures climbing about 1% and 1.8%, respectively.
The drop in energy prices has reduced one of the largest macro risks hanging over financial markets in recent months. A prolonged blockage of the Strait of Hormuz had removed millions of barrels of oil from global supply chains, fueling inflation concerns and raising questions about how aggressively the Federal Reserve might need to respond.
Bitcoin’s advance has also arrived as derivatives traders return to the market. CoinGlass data showed Bitcoin open interest rising to roughly $46.13 billion, while the weighted funding rate remained slightly positive at 0.0029%. The combination suggests traders are adding exposure without the excessive leverage often seen near local tops.
Bitcoin faces major resistance between $67.5K and $75K
On the technical side, Bitcoin has broken above the $64,500 resistance area highlighted by several market analysts over the weekend. The four-hour chart shows BTC confirming a breakout from an ascending triangle, a bullish continuation pattern characterized by rising lows pressing against a horizontal resistance zone. The move has also pushed Bitcoin back above its 20-period and 50-period moving averages.
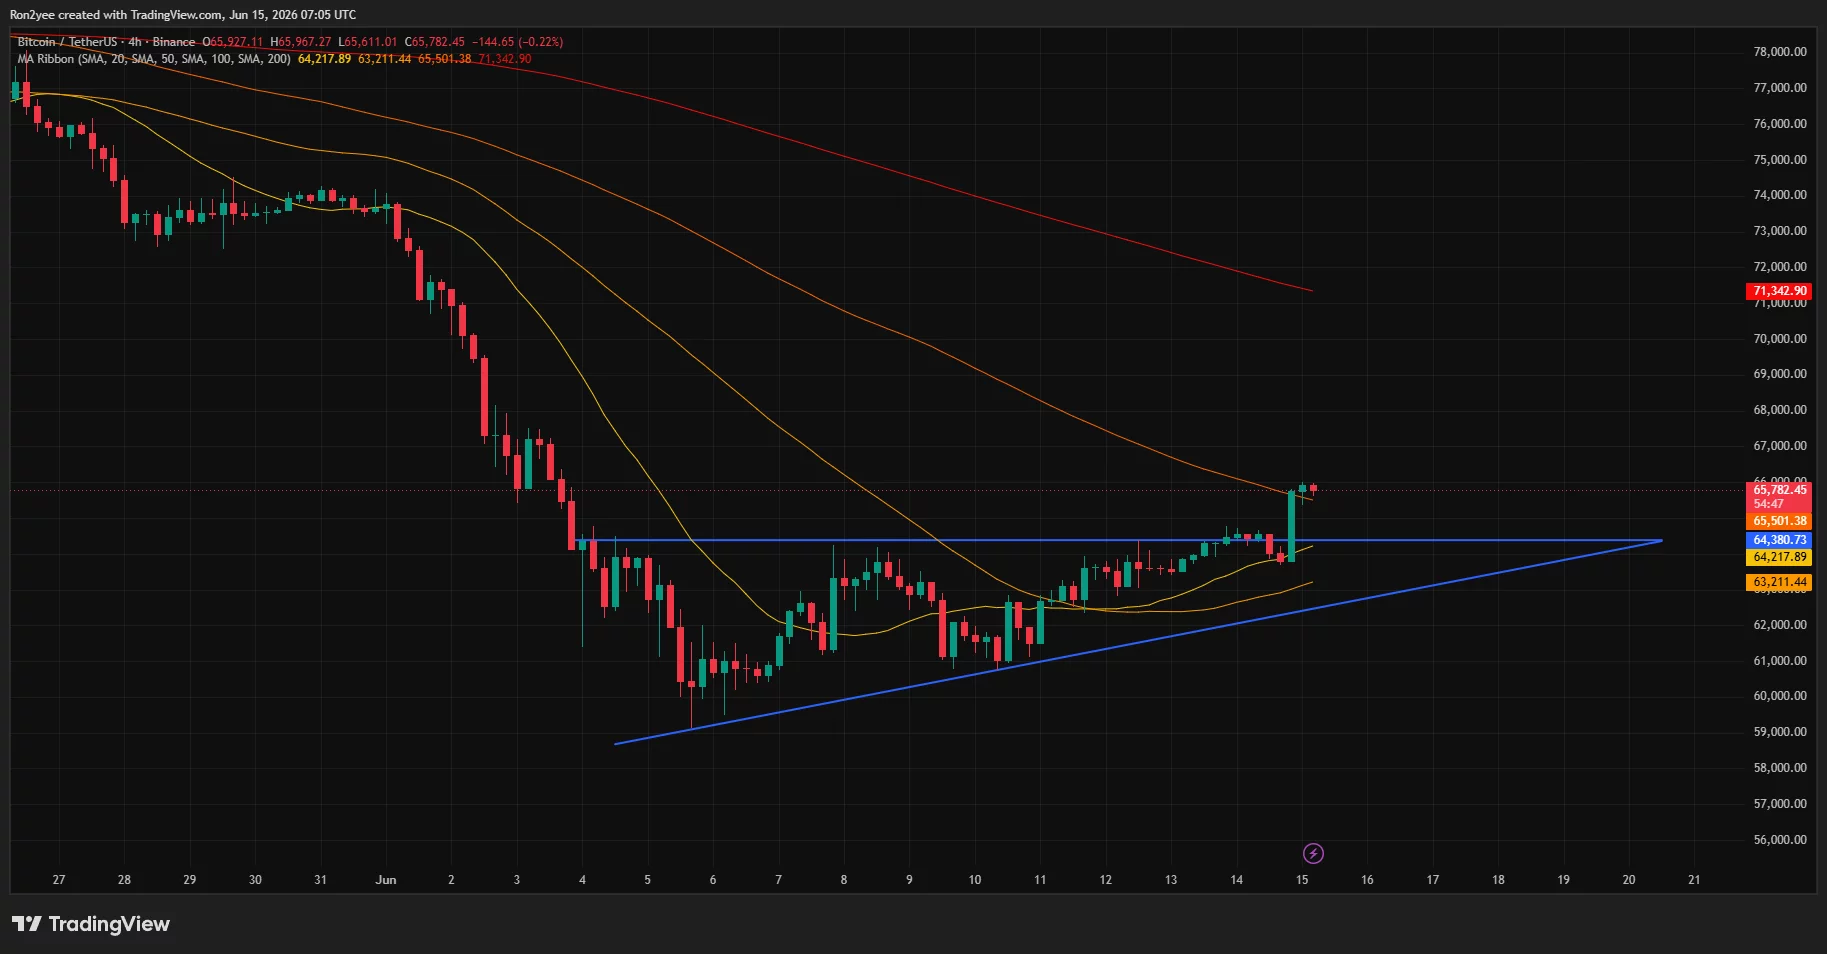
The next major resistance sits near $67,500, a level that coincides with a large liquidation cluster visible on CoinGlass’ three-day heatmap.
According to analyst Kamile Uray, Bitcoin’s outlook remains constructive as long as the recent breakout holds.
Uray identified $67,500 as the first major hurdle. A successful break above that level could open a path toward the $74,000-$75,000 region, which aligns with the 0.236 Fibonacci retracement level on the daily chart.
Beyond that, the analyst pointed to $82,885 as the level that would need to give way before a move toward $98,000 becomes realistic.
The daily chart shows Bitcoin pushing into a major resistance area between $65,500 and $67,500 after reclaiming the 0.786 Fibonacci retracement level near $64,220. A decisive close above that zone would strengthen the case for a move toward the $74,000-$75,000 region.
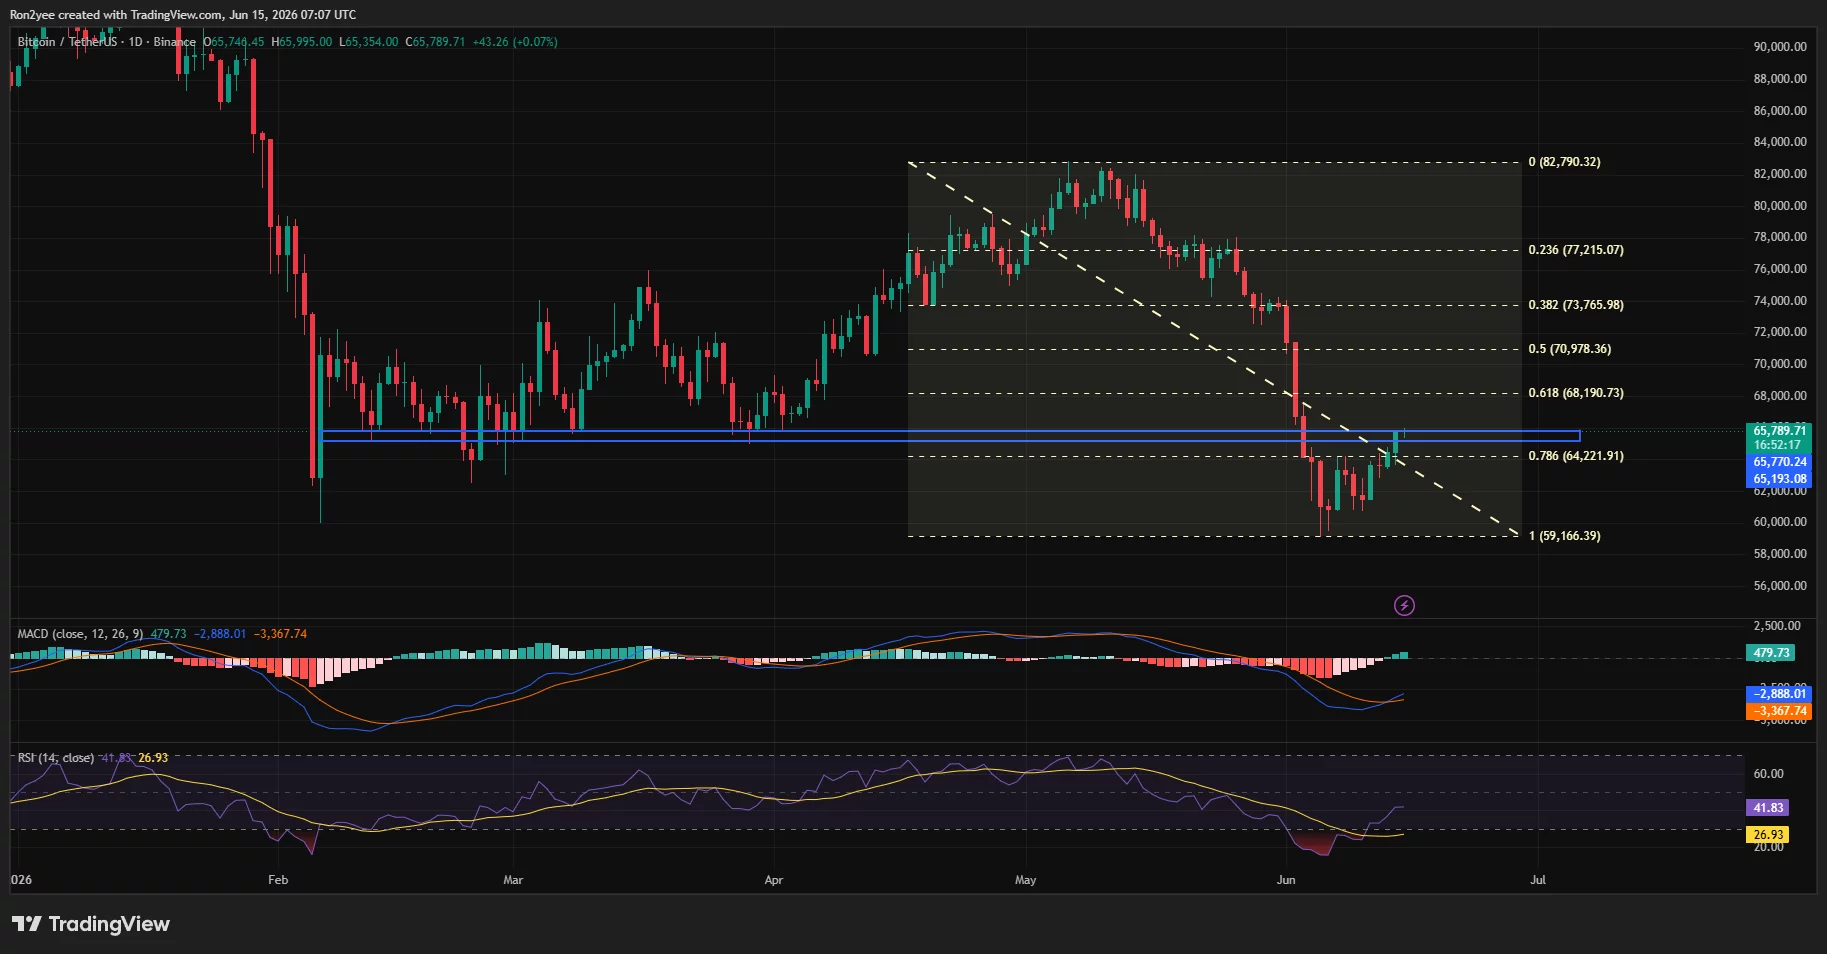
The daily RSI has climbed back above 40 from oversold territory, while the MACD histogram has crossed into positive territory for the first time in weeks.
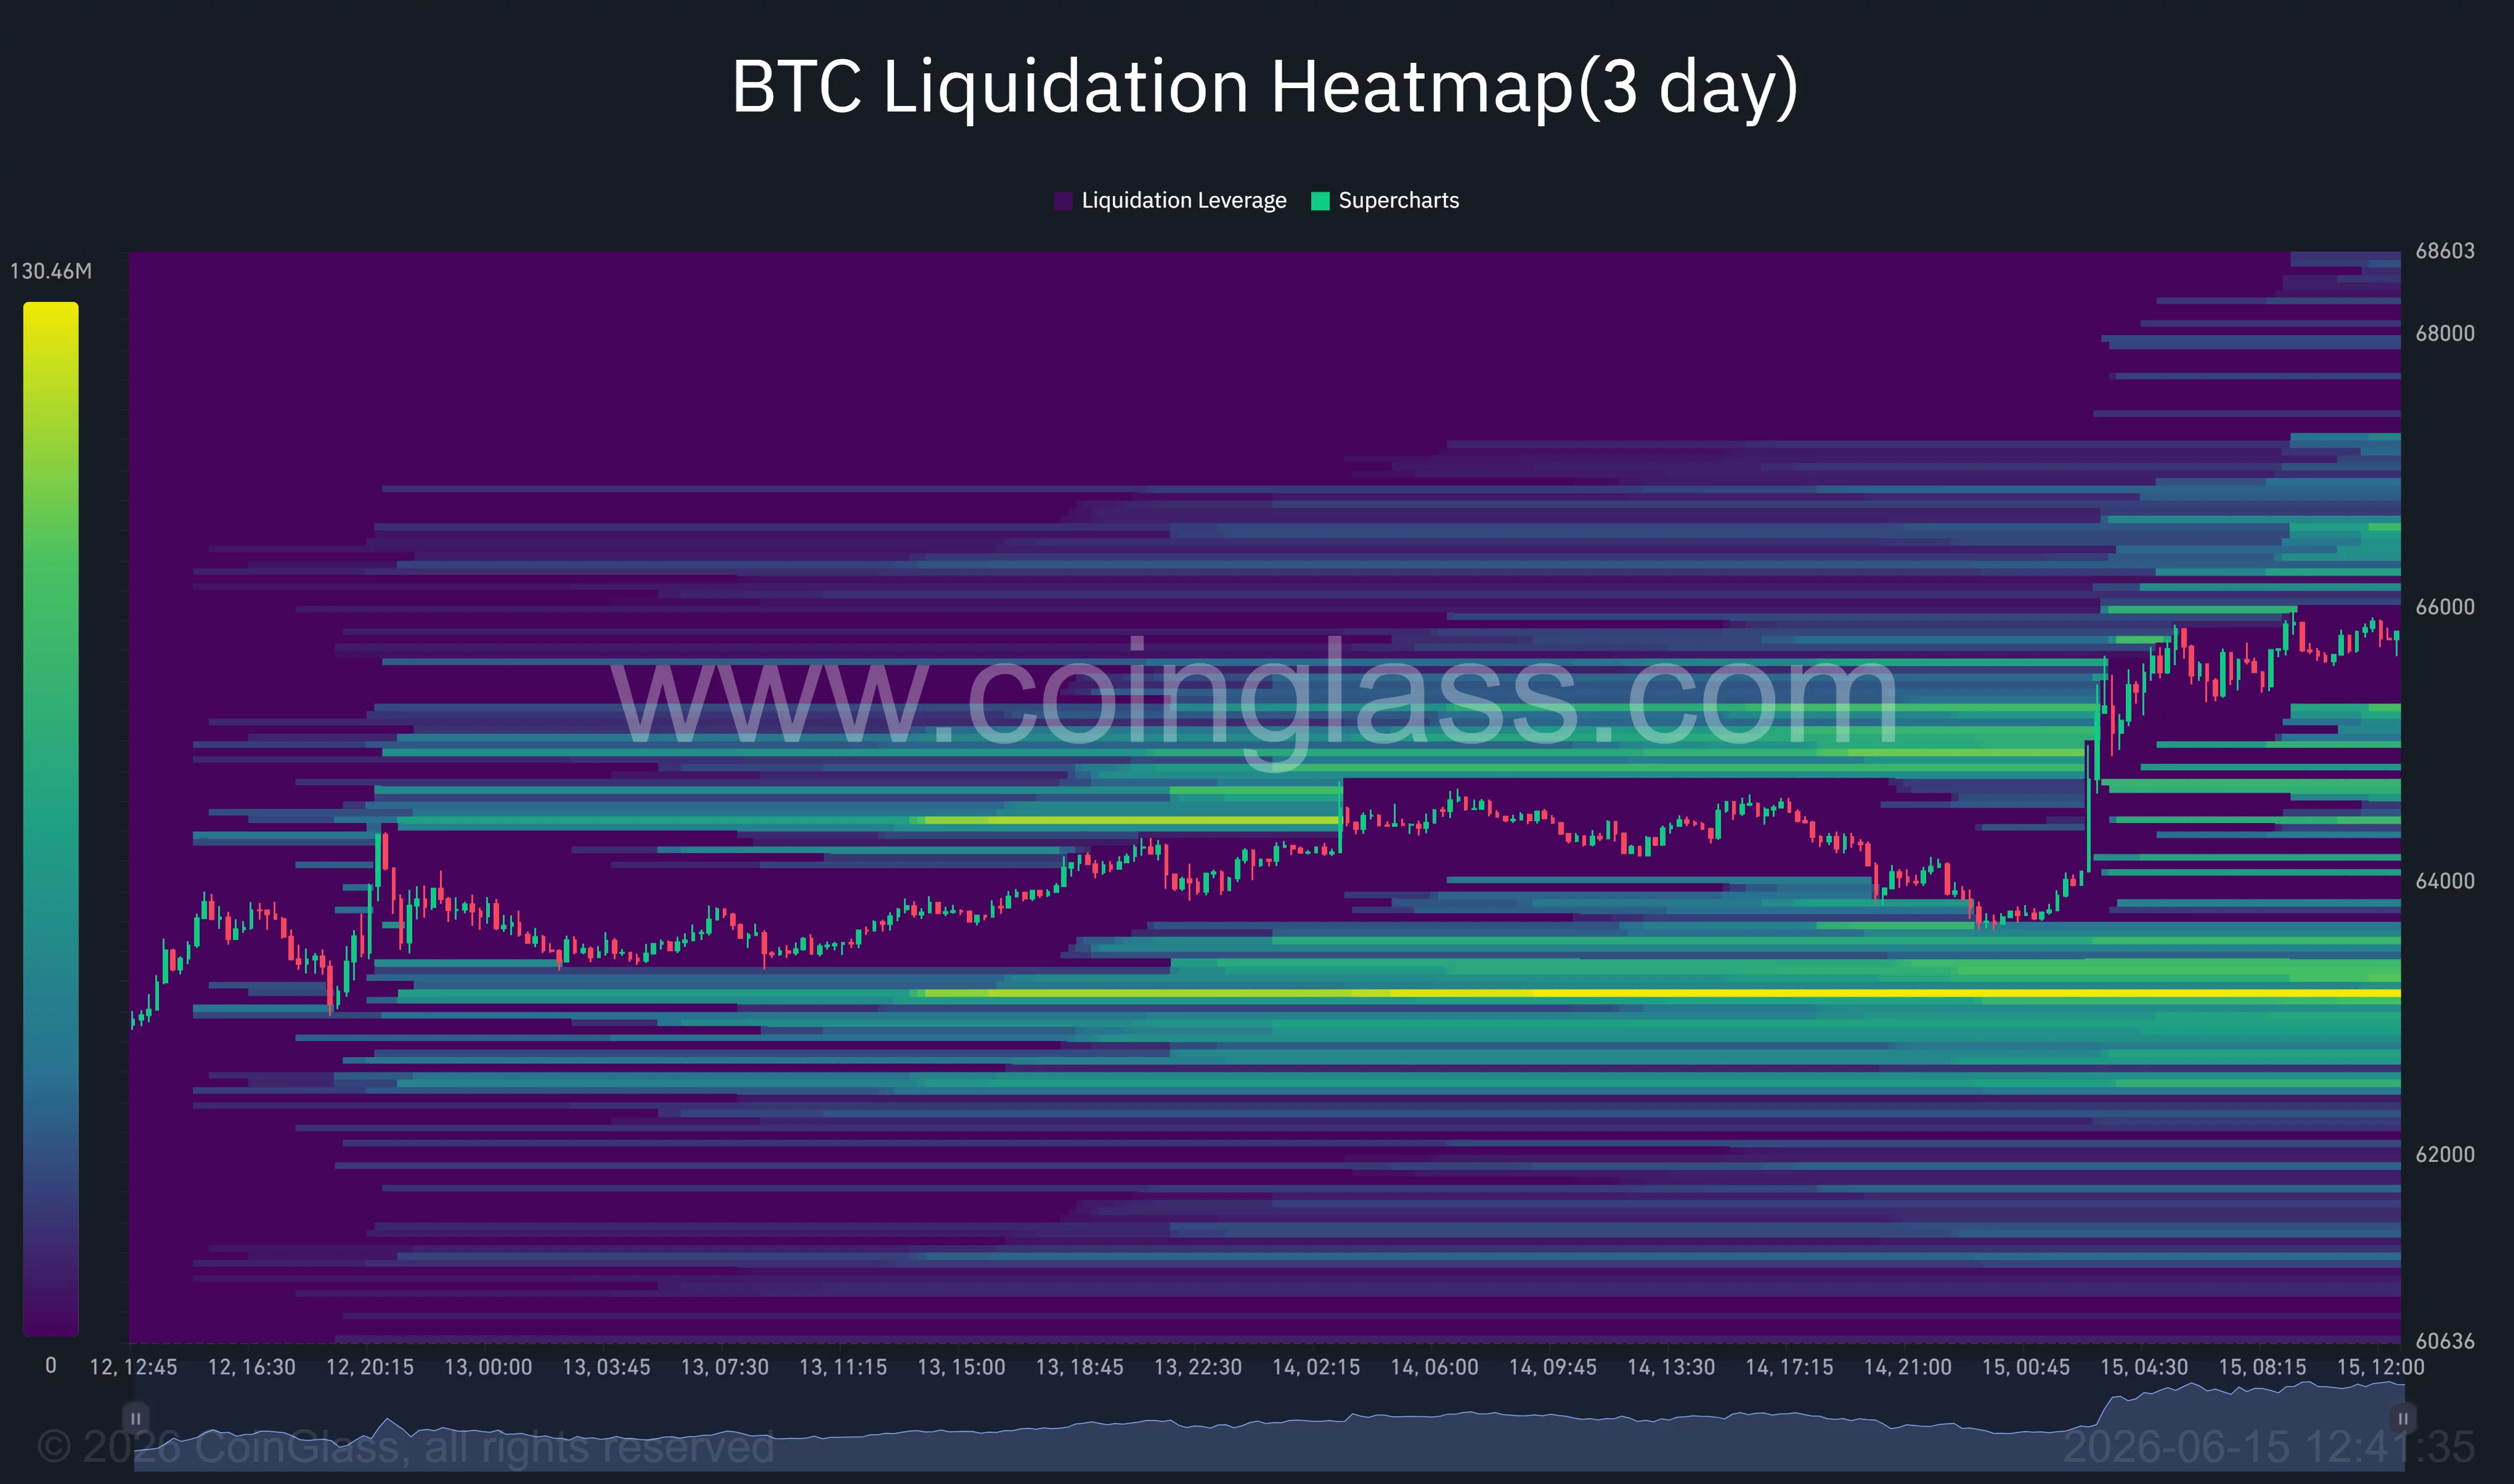
Liquidation data highlights another important factor. CoinGlass heatmaps show dense short liquidation pockets concentrated between $67,000 and $68,500. If Bitcoin reaches those levels, forced short covering could accelerate the rally and create additional upside momentum.
Weak ETF demand keeps downside risks in play
Despite the rebound, institutional participation remains a concern. U.S. spot Bitcoin ETFs have recorded only two days of net inflows since May 15, while accumulating roughly $5 billion in net outflows during the same period.
Last year, these funds were a major catalyst for Bitcoin, helping drive the asset to an all-time high above $126,000 in October 2025. Continued weakness in ETF demand would remove one of the strongest sources of institutional buying that supported the previous bull run.
Some traders remain skeptical that the latest rally represents the start of a sustained recovery. Commenting on the recent bounce, market analyst CryptoBullet argued that Bitcoin could still face another leg lower, as he believes the present recovery is merely a “small dead cat bounce.”
In technical analysis, a dead cat bounce refers to a temporary recovery during a broader downtrend, where prices rebound sharply before resuming their decline and falling to new lows.
The bearish case gains traction if Bitcoin loses the breakout zone between $63,700 and $64,500. Heatmap data shows significant liquidity resting near $63,000, while a deeper pullback could expose the psychologically important $60,000 level.
Uray identified $60,000 as the key level that bulls must defend to avoid opening the door to a decline toward the $55,000-$50,000 range.
Disclosure: This article does not represent investment advice. The content and materials featured on this page are for educational purposes only.


You May Also Like

BitGo Launches Stablecoin Minting and Redemption Service for Institutions

Web3’s Transaction Privacy Is Stuck Between Mass Adoption and Regulation. Is There a Sweet Spot?

Higher Education Ministry weighs legal action after Haim Hilman alleges ‘backdoor’ entry into public universities


