

ETH Rainbow Chart Explained: How to Read the Color Bands
- The rainbow chart paints ETH's price cycles — read our complete Ethereum guide for what lies beneath.
- The ETH rainbow chart is a long-term valuation tool that uses a logarithmic growth curve to map Ethereum's price history onto color-coded bands.
- Cold colors (blue and green) indicate that ETH is trading below its historical trend, while hot colors (red and orange) signal potentially overbought conditions.
- The chart was originally created for Bitcoin and later adapted for Ethereum, which has a shorter price history and a different formula.
- ETH's price cycles are generally correlated with Bitcoin's halving events, which occur approximately every four years.
- The rainbow chart does not predict exact prices — it shows where ETH stands relative to its long-term trend, not where it is headed.
- It should always be used alongside other tools and research, and never as a standalone basis for any investment decision.
What the ETH Rainbow Chart Is
- For the full history beneath the bands, read our Ethereum price history by year, every major bull run and crash explained
- For forward-looking bands, see our complete Ethereum price prediction with short-term signals and long-term price targets
How the ETH Rainbow Chart Color Bands Work
- For tactical levels, see our Ethereum key support and resistance levels technical analysis guide alongside rainbow bands
- Dark blue / "Fire Sale" — ETH is deeply undervalued relative to its long-term trend
- Blue / "Undervalued" — Price sits below the long-term trend, indicating historically discounted levels
- Green / "Accumulate" + "Still Cheap" — ETH is inexpensive relative to its growth curve
- Yellow / "Steady" — Neutral territory; price tracks closely with the long-term trend
- Orange / "HODL!" — Elevated pricing; long-term holders typically hold their positions
- Red / "FOMO Intensifies" → Dark Red / "Maximum Bubble Territory" — ETH is historically overbought; correction risk is elevated
Rainbow Chart ETH vs. Bitcoin Rainbow Chart
Same Math, Different Asset
Why ETH Cycles Look More Extreme
How Bitcoin's Halving Cycle Affects Both Charts
How to Use the ETH Rainbow Chart
Limitations of the ETH Rainbow Chart
How to Buy ETH on MEXC
- Create an account — Sign up at MEXC and complete identity verification
- Deposit funds — Add fiat currency or crypto to your MEXC wallet
- Search for ETH — Navigate to the ETH trading pair of your choice
- Place your order — Choose market or limit order depending on your strategy
- Store securely — Transfer ETH to a personal wallet for long-term holding
Frequently Asked Questions
Conclusion
- Color bands come and go — see our full Ethereum guide for why ETH matters long term.
Popular Articles
View More
The US-Iran Peace Deal Just Reset the Ethereum (ETH) Price Prediction, and the Numbers Back It Up
Peace changed the calculus for ETH, and not in the way most investors expected. When the US-Iran ceasefire was confirmed in June 2026, Ethereum did not simply recover alongside the broader market. It

ETH/BTC Ratio: What It Means, How It Moves, and Why It Matters
The ETH/BTC ratio is one of the most closely watched numbers in crypto — and for good reason. It tells you, at a glance, whether Ethereum is gaining ground on Bitcoin or falling behind, without ever

Will Ethereum Price Recover After a 60% Drop? ETH Price Prediction for June 2026
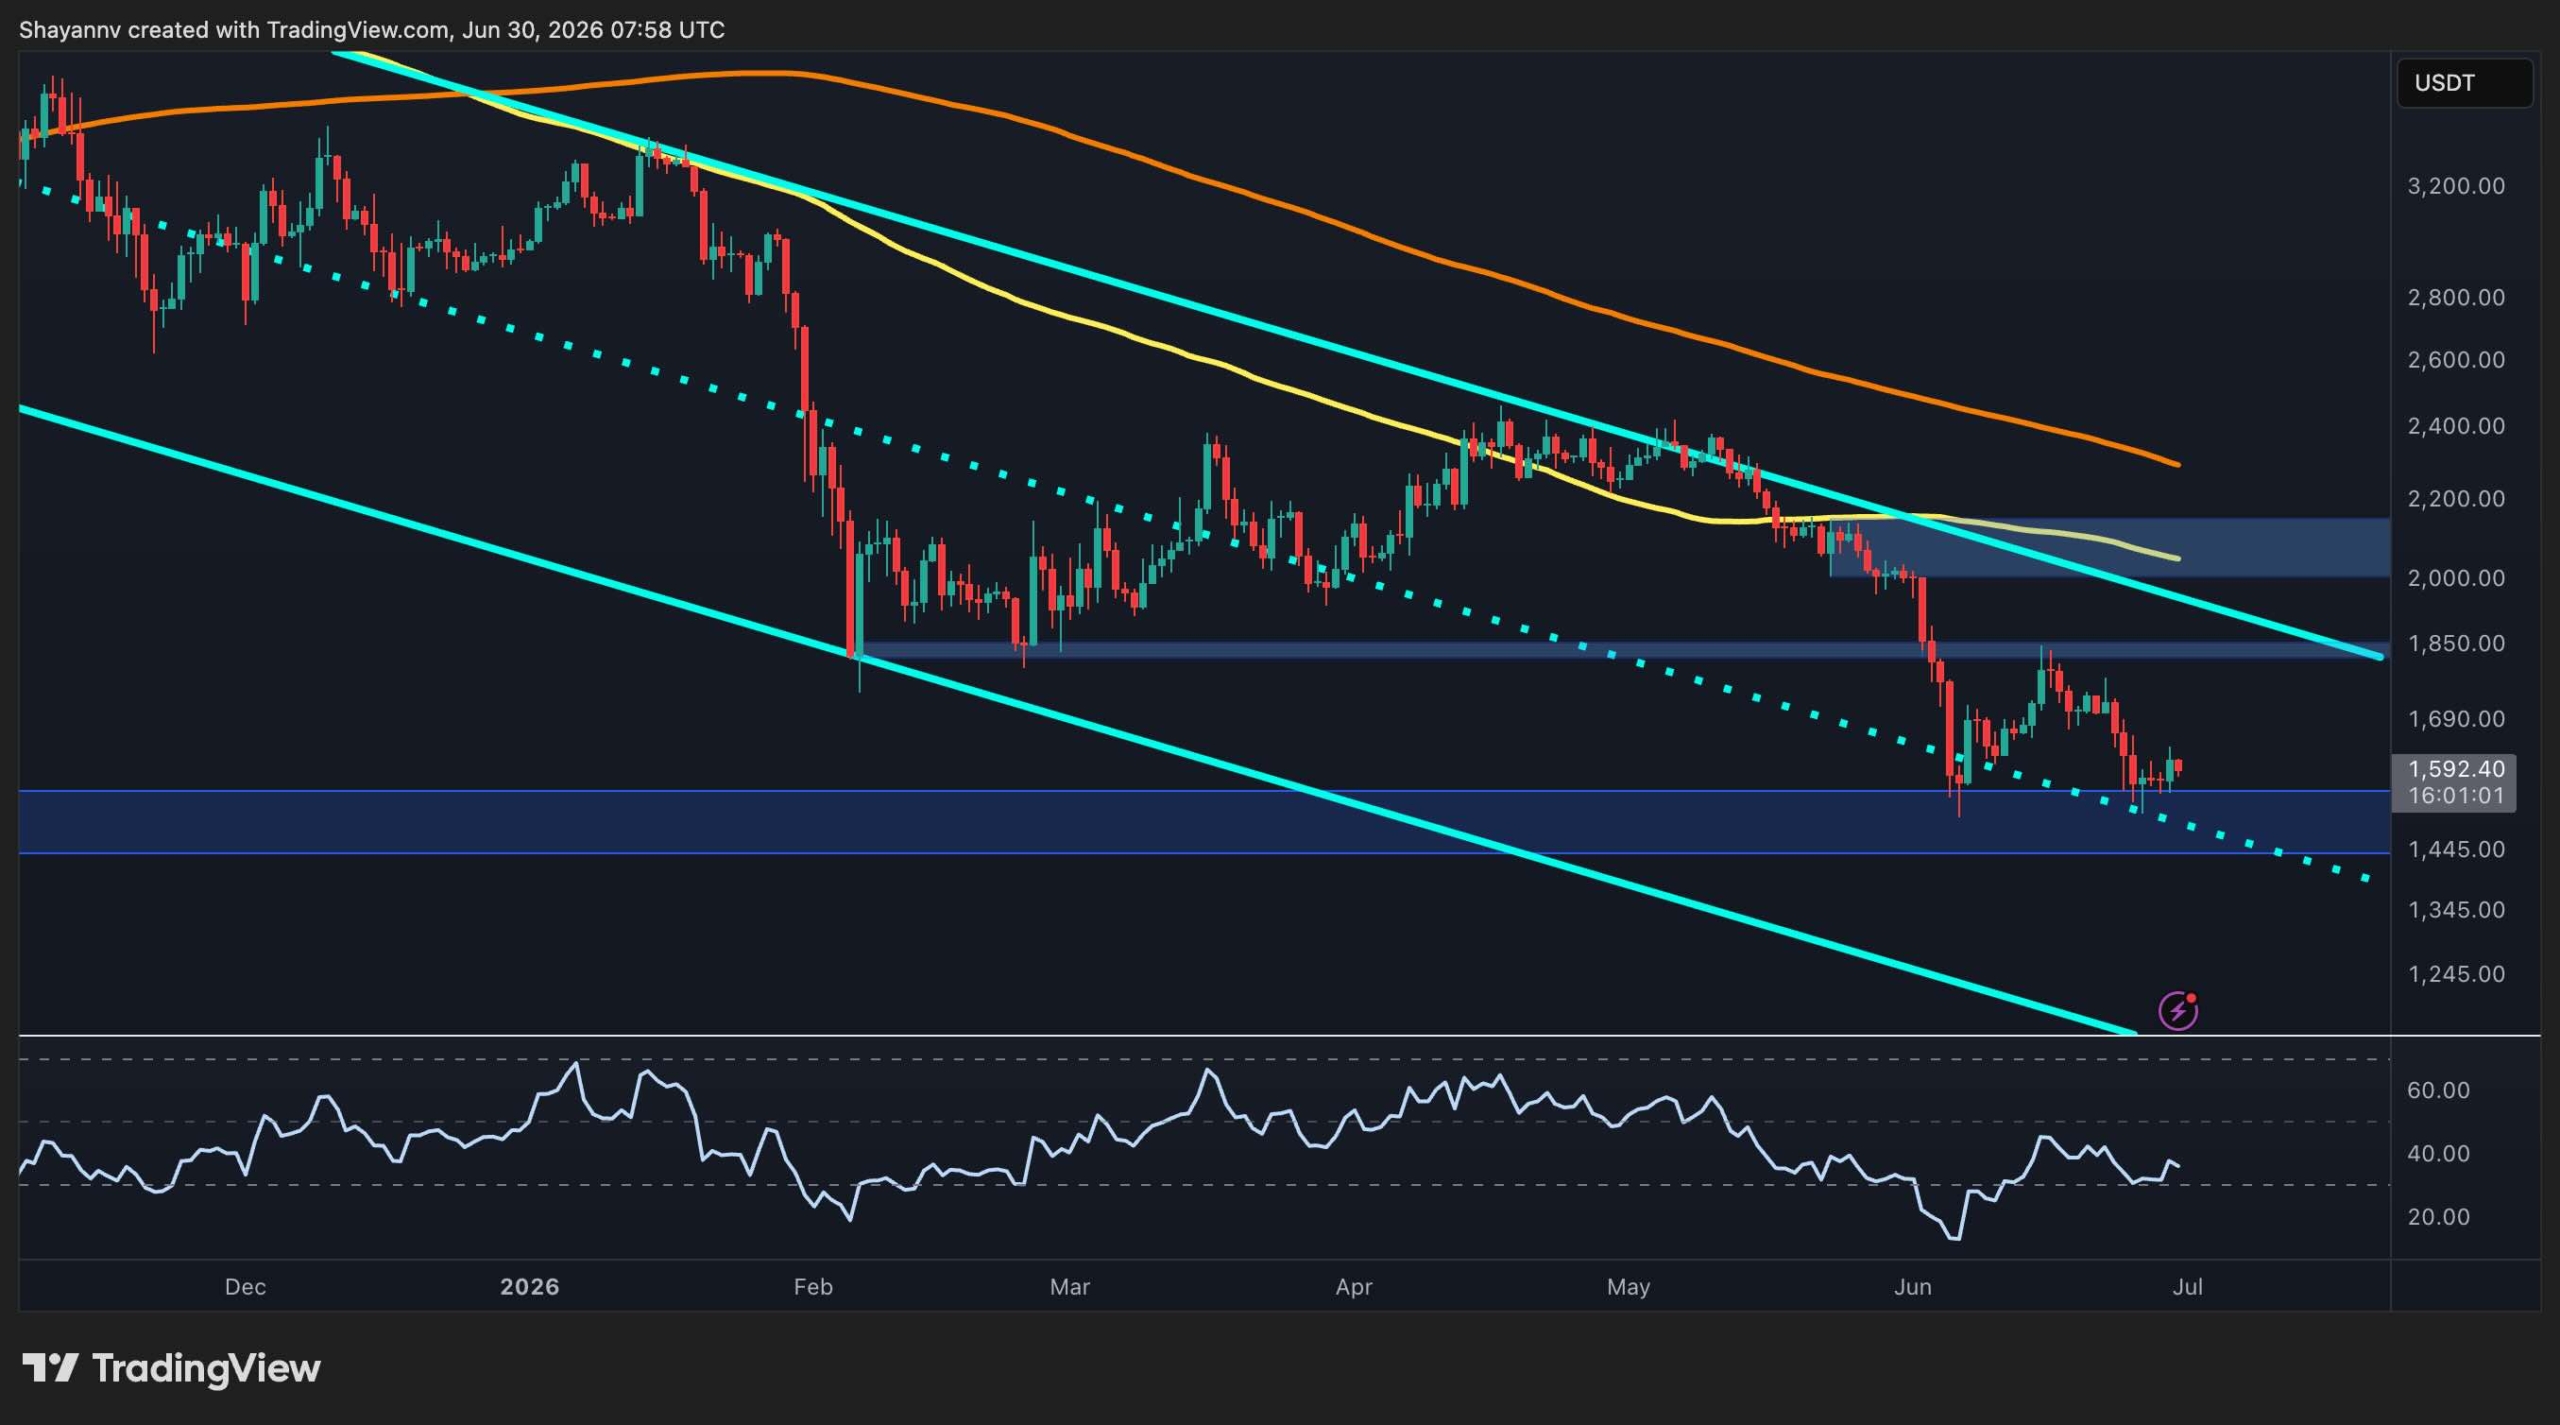
ETH opened June 2026 near $1,975, down approximately 60% from the all-time high of approximately $4,954 it reached in August 2025. The slide covers nine consecutive months of pressure: persistent ETF

Hot Crypto Updates
View More
ETH Just Crashed Below $1,700 — Is This the Bottom or a Trap?
Overview Ethereum has had a brutal 2026. From a peak near $4,954 in August 2025, ETH tumbled more than 60 percent, briefly touching the $1,600 zone in June after nine consecutive months of selling

Ethlabs Launches Former Ethereum Foundation Researchers Establish New Organization to Drive Institutional Adoption on Ethereum
Ethereum has witnessed the emergence of a new independent research organization called Ethlabs, founded by five former senior researchers from the Ethereum Foundation. Backed by major industry

Market Bleeds, Whales Buy: Inside the $10.7B Ethereum Empire Betting Big on H2 2026
Overview While 338 out of 390 major crypto tokens are in the red, one NYSE-listed company has been quietly building the largest Ethereum treasury in history. Bitmine Immersion Technologies (NYSE:

Ethereum Foundation Hits Reset: Vitalik Reveals Leaner EF, Less ETH Selling, and a CROPS-First Strategy
Vitalik Buterin announces the Ethereum Foundation will "slim down," reduce ETH sales, and refocus exclusively on CROPS — censorship resistance, openness, privacy, and security. Here's what it means
Trending News
View More
What is the ETH/BTC ratio? How to read Ethereum’s performance against Bitcoin
The ETH/BTC ratio prices Ethereum in Bitcoin instead of dollars, stripping out the market-wide move so you can see which of the two is actually winning. Here is
SharpLink buys more Ethereum as ETH heads for rare quarterly slump
SharpLink has expanded its Ethereum treasury with another 10,000 ETH purchase even as the cryptocurrency has remained on course for its third consecutive quarterly
Related Articles
View More
What If Stock Dividends Built Your Bitcoin Position Automatically? The Franklin Templeton Bitcoin DRIP ETF Explained
Wall Street has just filed for an automatic Bitcoin buyer, and if approved, it would run on dividends.In June 2026, Franklin Templeton, an asset manager overseeing more than $1.5 trillion in assets gl

Bitcoin Bank: What It Is and How to Move Money Between BTC and Your Bank
Bitcoin and banks used to feel like opposites.One was built to bypass the financial system — the other is the financial system.But that divide is closing fast, and if you own Bitcoin or plan to buy so

What Is Bitcoin Trader? What the Scam Warnings and Reviews Really Say
You've probably seen the name Bitcoin Trader pop up in an ad, a forum thread, or maybe a suspicious celebrity endorsement.Before you click anything, it's worth knowing exactly what this platform is —


