

Crude Oil Futures Chart: How to Read the Energy Market
If you want to trade global energy, the crude oil futures chart is your most important tool. It is not just a picture of past prices. It is a live map of human psychology, supply, and demand.
Many beginners look at a trading chart and feel confused by the green and red bars. In this guide, I will explain exactly how to read a crude oil futures chart. I will also show you how to spot macro trends and execute trades using MEXC.
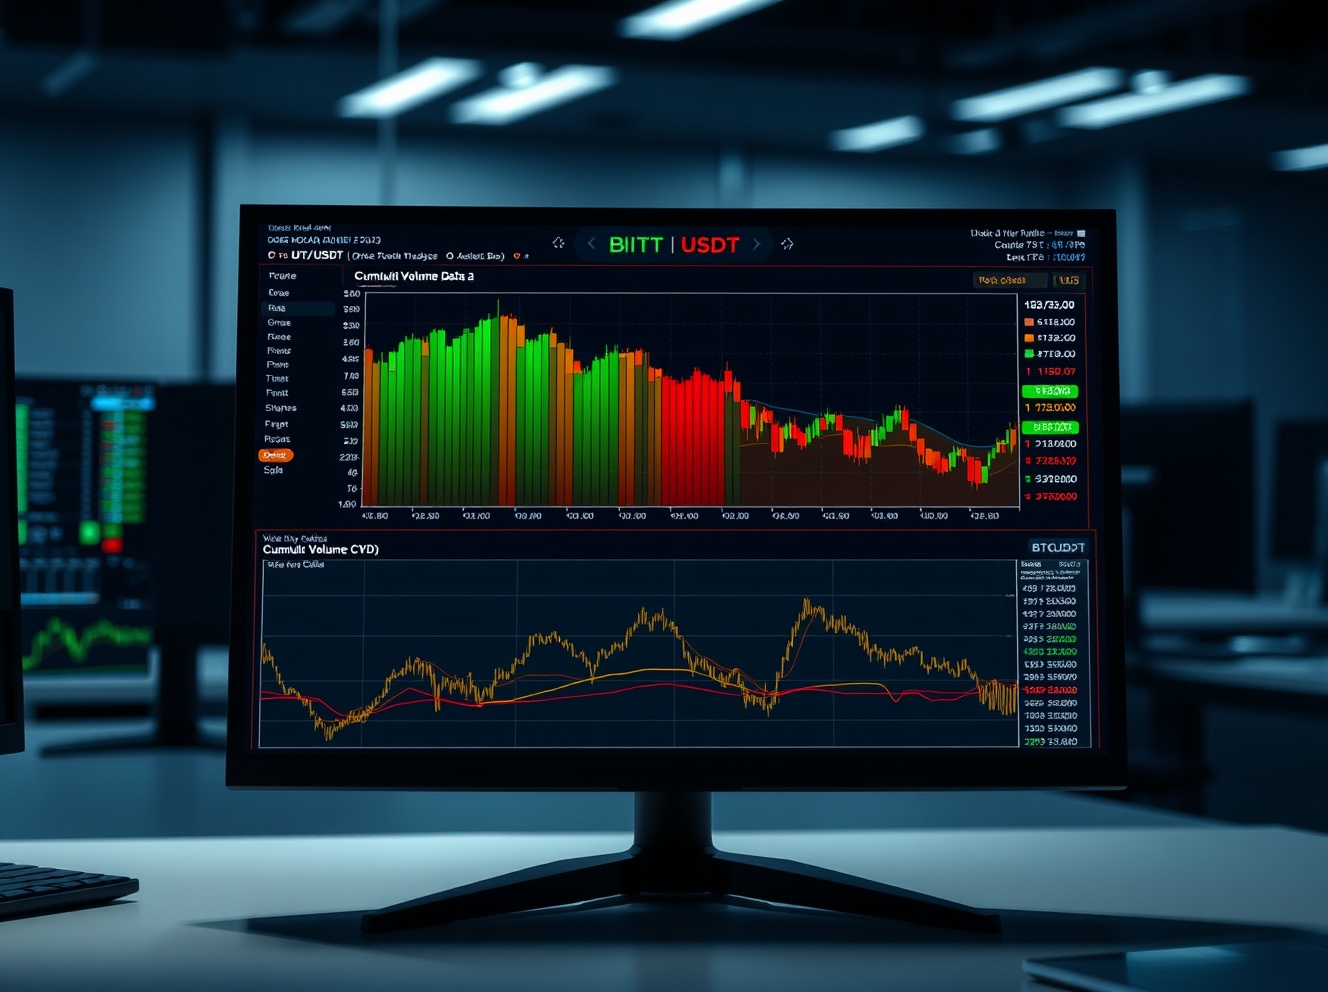
The Anatomy of a Candlestick
Most professional traders use a "candlestick" chart (or K-line chart) to track oil prices. Each candlestick shows you the price action for a specific time period, like one hour or one day.
Every single candlestick gives you four critical pieces of data, known as OHLC:
Open: The price when the time period started.
High: The highest price reached during that time.
Low: The lowest price dropped to during that time.
Close: The final price when the time period ended.
If the Close is higher than the Open, the candlestick is green (Bullish). Buyers won the battle. If the Close is lower than the Open, the candlestick is red (Bearish). Sellers pushed the price down.
WTI vs. Brent on the Chart
When you open an exchange, you will see different charts for different types of oil. You must choose the right chart for your strategy.
If you are trading US economic data, you should open the WTI chart. If you are trading Middle East news, you should open the Brent chart. To understand why these two charts move slightly differently during a crisis, read our guide on the difference between WTI and Brent.
Interactive Chart Reading Simulator
The best way to understand a crude oil futures chart is to interact with one. Use the educational simulator below to see how candlesticks form. You can trigger different macro events to see how the chart reacts in real time.
Hover over the candles to read the exact Open, High, Low, and Close data.
Why 24/7 Chart Access Matters
Traditional commodity markets close on Friday evening. They do not open again until Monday morning. This creates a massive problem.
If a war starts on Saturday, the oil price will gap up massively. Traditional traders cannot see this on their charts or protect their money until Monday. By then, it is too late.
This is why modern traders use synthetic derivatives. If you want to know how this works behind the scenes, read what are crypto crude oil futures. Because crypto exchanges never sleep, your WTI and Brent charts update 24 hours a day, 7 days a week. You can see the price action the exact second a news story breaks.
Execute Your Strategy on MEXC
Once you know how to read the chart, it is time to trade. If you are ready to learn how to trade crude oil with USDT, MEXC provides the ultimate platform.
Here is why you should trade oil on MEXC:
0% Trading Fees: Every time a candlestick closes, you can enter or exit a trade without paying high broker commissions.
200x Leverage: You can use a small amount of capital to catch big profits from minor chart breakouts.
Deep Liquidity: MEXC offers institutional-grade order books. This means your market orders execute instantly, exactly where you see the price on the chart.
Do not trade blindly. Learn the chart, manage your risk, and trade the global energy market with confidence. Log in to MEXC, open the USOIL or UKOIL chart, and start catching the next big macro trend today.
Popular Articles
View More
Toncoin (GRAM) Price Prediction July 2026: Can It Break $1.90?
Toncoin just changed its name. On June 15, 2026, the token traders knew as TON became GRAM, closing the loop on a rebrand that traces all the way back to Telegram's original 2018 whitepaper. That

SUI Price Prediction July 2026: Can Sui Break $1 Again?
SUI climbed more than 8% over the past week, one of its stronger short-term moves after a rough June. That kind of bounce raises an obvious question: is this the start of something bigger, or just a
US Stock Trading Psychology: Why Can You Lose Money Even If You Get the Direction Right
Getting the direction right is the part of trading that feels like the hard part. It is not. A trader who correctly identifies that a stock is going to rise over the next two weeks can still lose
Hot Crypto Updates
View More
How to Buy SK Hynix Stock in 2026
Overview SK Hynix has become one of the most closely watched semiconductor stocks in the AI era. As demand for high-bandwidth memory, advanced DRAM, NAND, and AI server infrastructure grows, more

Who Is Ansem? The Solana Trader Behind The Black Bull ($ANSEM)
Who is Ansem? Discover the real identity of Solana's most influential crypto trader, how he built his reputation, and what you need to know about the $ANSEM (The Black Bull) memecoin that exploded

Is Solana Memecoin Season Back? What On-Chain Data Reveals
Is Solana Memecoin Season back? Pump.fun DEX volume hit a record $2B in a single day, on-chain wallets surged, and the Solana meme market cap climbed 31% in weeks. Here is what the data actually

Trending News
View More
Plumbers Retire Richer Than Their Bosses And Here’s How the Pension Works
Here is the uncomfortable truth about the plumbing trade: the journeyman turning wrenches in a hospital basement often walks into retirement with a bigger, more

Forget College? The AI Boom Is Creating a New Generation of Six-Figure Trade Jobs
On Fox Business’s The Bottom Line this week, Mike Rowe told viewers: “You cannot reinvigorate the trades without reimagining the way we train the next generation

Related Articles
View More
Is TELUS Stock a Buy for 2026? Dividend Yield, Debt, and the AI Infrastructure Bet
TELUS stock has become a classic income-investor dilemma. On one side, TELUS is a major Canadian telecom operator with recurring revenue, a long dividend history, nationwide wireless and fibre assets,
Old European Coin Crossword Clue: Most Likely Answers and How to Solve It
If you are stuck on the crossword clue “old European coin,” the answer is most likely ECU, especially if the puzzle gives you three letters. ECU is a favorite crossword answer because it is short, his
Open USD Stablecoin (OUSD): Why the New Stablecoin Alliance Matters
Open USD Stablecoin, also referred to as OUSD, has quickly become one of the most important stablecoin stories of 2026. Unlike many new digital assets that begin inside a small crypto-native community


