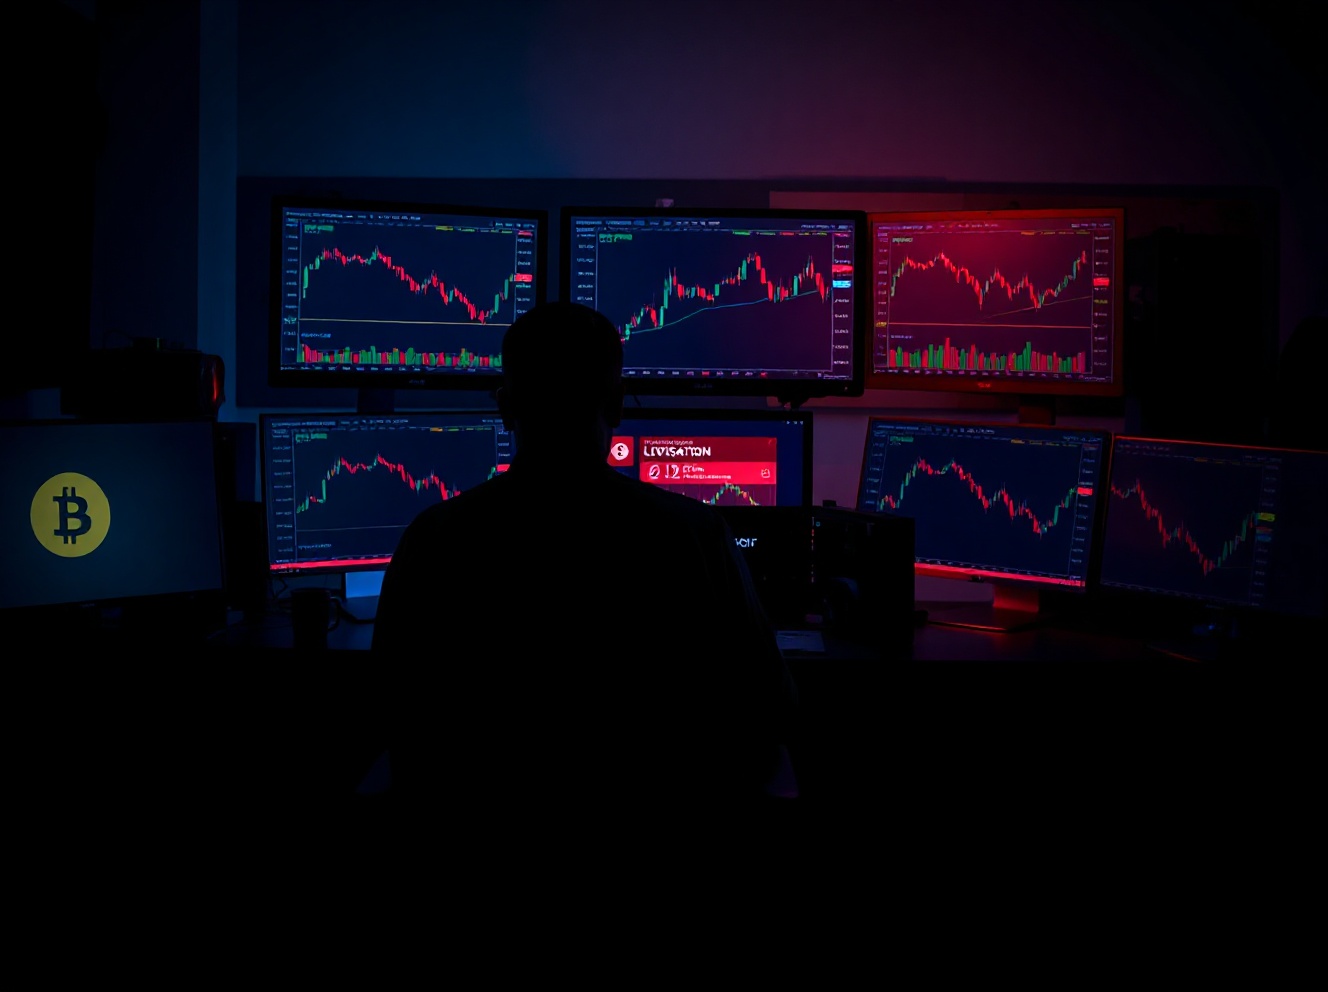
BTC Liquidation Heatmap: What It Is and How to Use It
- A BTC liquidation heatmap is a color-coded visual tool that maps where clusters of leveraged Bitcoin positions are estimated to be force-closed.
- Yellow zones indicate high liquidation density and often act as price magnets, while dark or blue zones signal low concentration.
- Zones above the current BTC price reveal at-risk long positions; zones below reveal at-risk short positions.
- Traders use the heatmap to set smarter stop-losses, identify likely price targets, and anticipate liquidation cascades.
- The heatmap works best as one layer in a broader strategy — always combine it with indicators like RSI, funding rate, and open interest for confirmation.
- CoinGlass and CoinAnk both offer free, real-time BTC liquidation heatmap access with no account required.
What Is a BTC Liquidation Heatmap?
How to Read the BTC Liquidation Heatmap
Where to Find a Live BTC Liquidation Heatmap
How Traders Use the BTC Heatmap to Make Decisions
Using Yellow Zones as Price Targets
Setting Stop-Losses Around Major Clusters
Anticipating Liquidation Cascades
Combining the Heatmap with Other Indicators
Matching Timeframe to Your Trading Style
FAQ
Conclusion
Popular Articles
View More
MSTR Stock Fell Nearly 60%! So Why Is the Analyst Strategy Price Target Still $351?
Strategy Inc. was once a software company. Today it is the world's largest publicly listed corporate Bitcoin holder by volume, with a treasury strategy that has become a benchmark for institutional
Bitcoin Difficulty Explained: What It Is, How It Adjusts, and Why It Matters
Key Takeaways Bitcoin difficulty measures how hard it is for miners to find a valid block hash on the Bitcoin blockchain. The Bitcoin difficulty adjustment happens automatically every 2,016 blocks —

Bitcoin Code Review: Is It Legit, a Scam, or Something Else?
The phrase "bitcoin code" shows up everywhere online — but it doesn't always mean the same thing. Depending on where you see it, it could refer to Bitcoin's open-source software, a QR code used to

Hot Crypto Updates
View More
Strategy Bought the Dip Below Its Own Cost Basis — and Triggered a $504M Short Squeeze
Strategy bought 1,550 BTC at $65,332 — below its own average cost for the first time. Bitcoin rebounded above $63,000 and wiped out $504 million in short positions in 24 hours. Here's what actually

Bitcoin Reclaims $60K: Why This Level Is the Most Important Number in Crypto Right Now
Bitcoin dipped below $60,000 for the first time since Trump's 2024 election win — then clawed back. Here's why this level matters, what the rebound signals, and why BTC's long-term case remains

Bitcoin Crashes Below $66K: $1.86B Liquidated — Perfect Storm or Buying Signal?
Bitcoin crashed to $65,000–$66,000 in 24 hours, triggering over $1.86B in liquidations. Strategy's first BTC sale in 4 years, record ETF outflows, US-Iran tensions, and an AI stock rotation all

Trending News
View More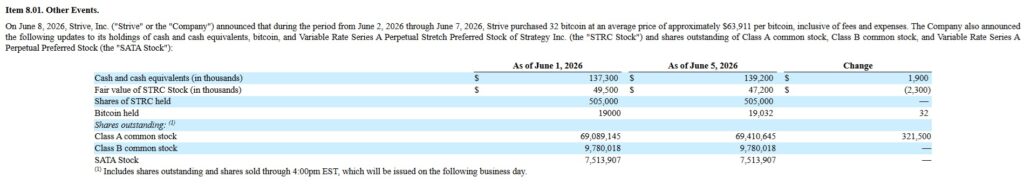
Vivek Ramaswamy-Backed Strive Trolls Strategy With A 32 Bitcoin Purchase
Strive Asset Management (ASST), a structured finance and institutional management company, disclosed that it bought 32 Bitcoin (BTC) last week. It came in response

Stablecoins Find An Unlikely Ally In Peter Schiff
The stablecoin community has recently found an unlikely ally in one of the loudest critics of Bitcoin (BTC) and cryptocurrencies. Peter Schiff, Founder and Chairman

Related Articles
View More
Jeffrey Epstein Bitcoin Connection: What the Files Prove (and What They Don't)
When the U.S. Department of Justice released millions of pages of Epstein files in early 2026, Bitcoin appeared in the documents over 1,500 times.That single fact was enough to send social media into

What Is Bitcoin Magazine? History, Pro Charts, and How to Follow It
If you've spent any time searching for Bitcoin news, you've almost certainly come across Bitcoin Magazine.It's the oldest publication dedicated exclusively to Bitcoin — launched before most people kne

Bitcoin Evolution: From $0 to $126K — The Complete Price History
Bitcoin started life worth less than a penny and now trades above six figures — a price journey few assets in history can match.This article traces the full Bitcoin evolution: how it launched from not