

Ethereum Tests $1,760 Support for the 4th Time, Whale Takes $6.4M Gain
A major on-chain wallet just cashed out $53.1 million. ETH is sitting on a trendline that has held since 2022. What happens at this level could set the pace for the months ahead.
Why Did the Ethereum Whale Sell 29,000 ETH for $53.1 Million?
A large on-chain wallet sold all 29,000 ETH in a single session. The total value of the sale came to $53.1 million.
The same wallet had purchased this Ethereum during last week's market dip. After a fast turnaround, the whale walked away with roughly $6.4 million in profit.
Transfers were routed through FalconX, 1inch, and Lido Staked Ether before reaching an OTC desk. When wallets of this size exist at current price levels, traders notice.
What Is Ethereum's Key Support Level and Why Does It Matter?
Ethereum is trading around $1,814 at the time of writing, up 5.16% on the day. On the weekly chart, however, the floor that matters most is $1,760.
This is where a multi-year ascending trendline meets the current price. ETH has touched this line three times before and bounced each time.
Analyst Celal Kucuker has identified $2,000 as the next critical line. A weekly close above $2,000 would signal a bullish momentum shift. Staying below it keeps downside risks on the table.
How Many Times Has Ethereum Retested This Multi-Year Trendline?
The weekly Binance chart shows four distinct touches of the same rising support line over several years.
Retest 1 came in mid-2022, near the floor of the last bear market. Retest 2 arrived in early 2025 after a pullback from cycle highs.
Retest 3 followed around mid-2025. Now in mid-2026, Ethereum is back at the same trendline for Retest 4.
Each previous touch led to a meaningful price recovery. The weekly chart projects a move back toward $4,000 if the trendline holds once again. That would be a gain of about 127% from $1,760.
What Are Ethereum's Price Targets for 2026 If It Bounces Here?
The daily chart shows ETH forming a descending wedge. This pattern typically suggests a potential breakout higher once the price compresses tightly enough inside the range.
Fibonacci retracement levels mapped from the $4,798 high give a clear roadmap if buyers return:
-
$2,028 is the first resistance to clear
-
$2,731 is the mid-range target
-
$4,768 aligns with a full recovery scenario
On the weekly chart, the projected move targets $4,000. Momentum needs to build above $2,000 first before any extended rally becomes realistic.
What Happens to Ethereum Price If It Breaks Below $1,760?
This is the scenario long-term bulls are hoping to avoid.
A weekly candle close below $1,760 breaks the trendline structure that has been holding since 2022. The next relevant support zones, based on Fibonacci extensions from the cycle high, fall at $1,424 and then $1,238.
Losing $1,760 on the weekly does not mean an instant collapse. But it removes the foundation of the multi-year bullish case. Traders who have been holding based on this trendline would need to reassess.
Is Ethereum Ready for a Bullish Reversal in Mid-2026?
The 5.16% daily gain is an encouraging start. The descending wedge visible on the daily chart is a structure that traders associate with potential breakouts to the upside.
That said, the whale who just sold $53.1M worth of ETH at these exact levels is a note of caution. Large wallets taking profit at resistance do not always mean more buying is coming right away.
The short-term test comes down to one question. Can Ethereum post a weekly close above $2,000? If yes, the next leg higher becomes more likely.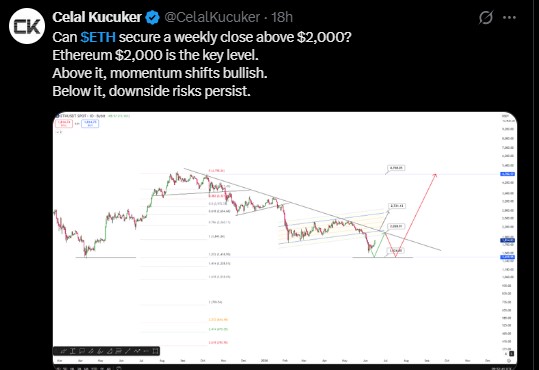
If not, the $1,760 trendline keeps absorbing pressure until either buyers push back hard or the level finally gives way.
Disclaimer: This article is for informational purposes only and does not constitute financial advice, investment guidance, or any recommendation to buy or sell any asset. Cryptocurrency markets are highly volatile and carry significant financial risk. Always conduct your own research before making any investment decision.


추천 콘텐츠

DC insider shoots down 'desperate' JD Vance's presidential dreams: 'No natural skills'

Cancer patient among 100,000 red state voters who lost food aid under Trump's new law

Why Lowe’s Stock Looks Undervalued After Its Q1 Margin Compression Results in 2026


인기 뉴스
더보기
