

Ethereum price tests multi-year support trendline, can it reclaim $2,000?
Ethereum price has rebounded toward $1,800 after buyers stepped in near a multi-year support trendline while easing geopolitical tensions triggered a sharp recovery across risk assets.
- Ethereum price surged more than 10% after the reported U.S.-Iran peace deal eased inflation concerns and pushed oil prices lower.
- ETH has rebounded from a key multi-year support trendline, with resistance levels at $1,873 and $2,000 now in focus.
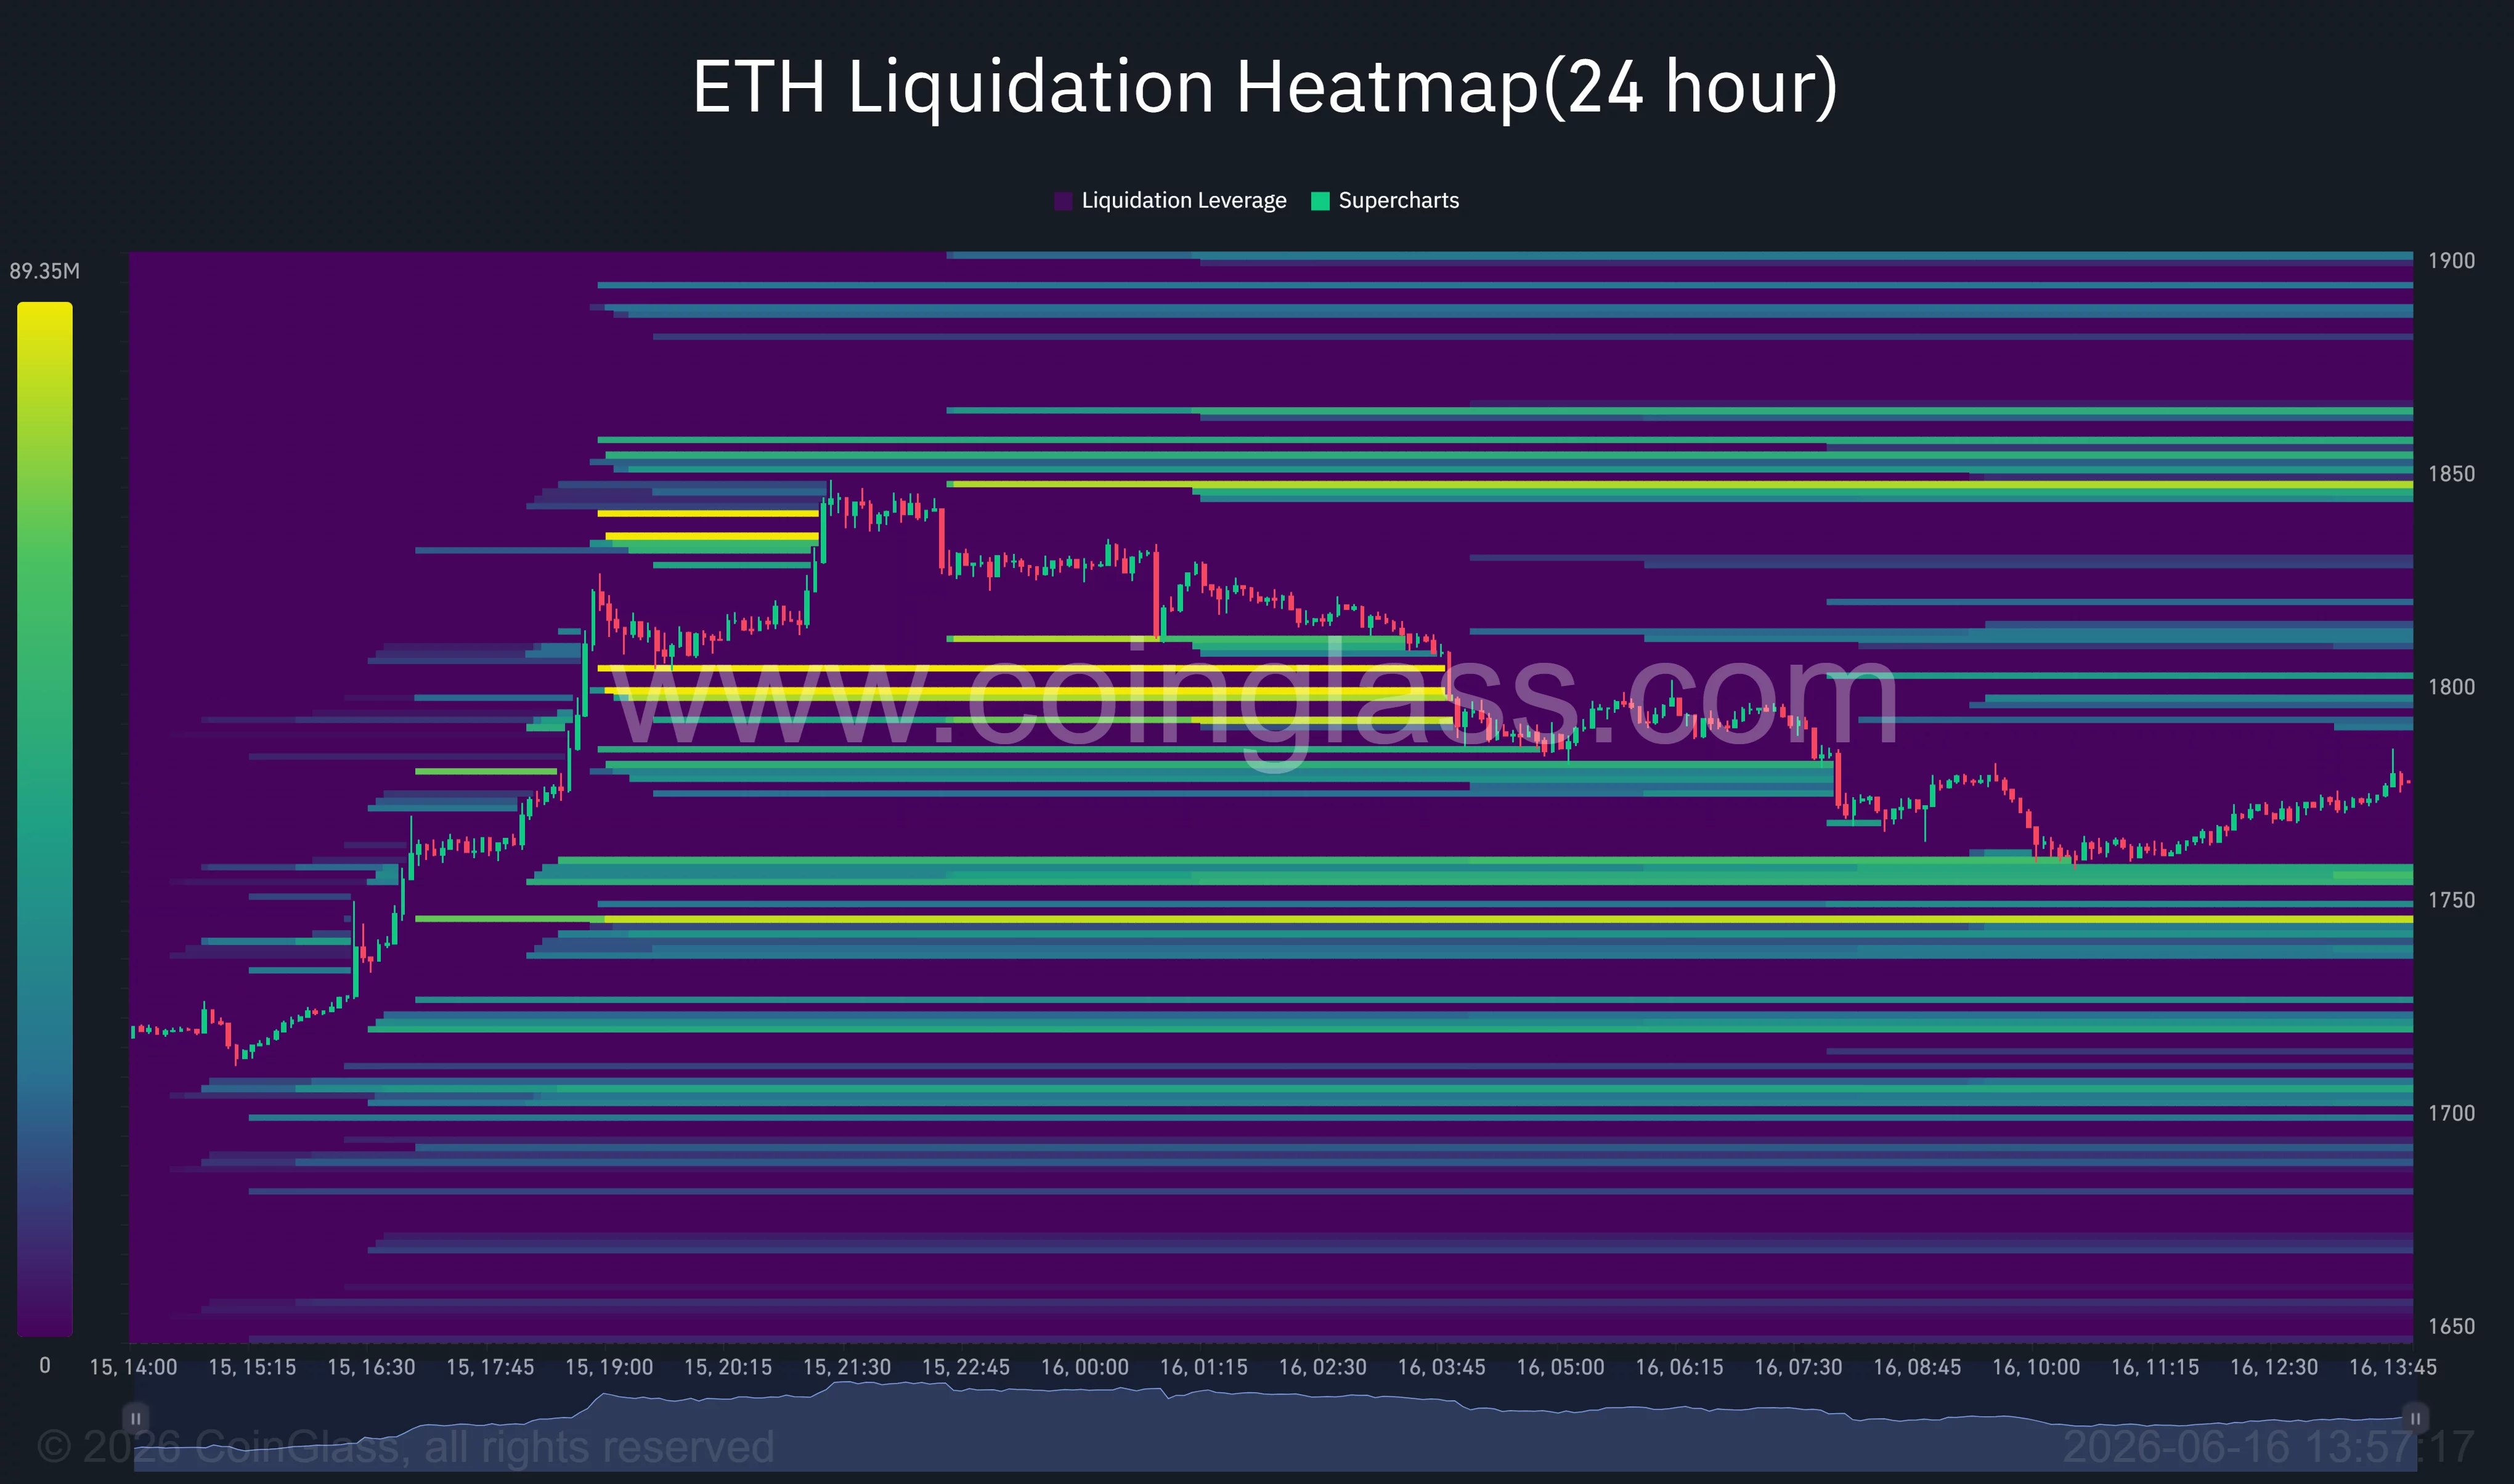
- CoinGlass data shows large short liquidation clusters above current prices, raising the possibility of a squeeze toward higher levels.
According to crypto.news market data, Ethereum (ETH) price surged more than 10% on June 15, reaching an intraday high above $1,800 before settling near $1,780 at Tuesday’s press time.
Before the latest rebound, Ethereum had dropped roughly 26% from early June levels near $2,050 to a local low around $1,507 as escalating tensions between the United States and Iran fueled inflation fears and prompted investors to reduce exposure to risk assets.
Ethereum sharp rebound on Monday followed reports that the United States and Iran had reached a framework peace agreement that could lead to the reopening of the Strait of Hormuz. The development eased concerns over energy supply disruptions and inflation that had weighed on risk assets for weeks.
Brent crude fell 2.2% below $82 per barrel on Tuesday while WTI dropped 2.5% to under $79 as traders priced in the possibility of uninterrupted oil flows from the Persian Gulf.
The improvement in market sentiment extended beyond oil markets. Bitcoin recovered above $66,000, while Ethereum attracted renewed buying interest after weeks of pressure from geopolitical tensions, inflation concerns, and capital flows shifting toward artificial intelligence investments and major technology listings.
Additional support came from whale activity. According to Lookonchain, a large over-the-counter investor sold 29,000 staked ETH worth roughly $53.1 million on June 16, locking in a $6.4 million profit after purchasing the tokens during last week’s market dip.
While the transaction represented profit-taking, it also highlighted the scale of accumulation that occurred near recent lows.
Ethereum price finds support where past bull runs began
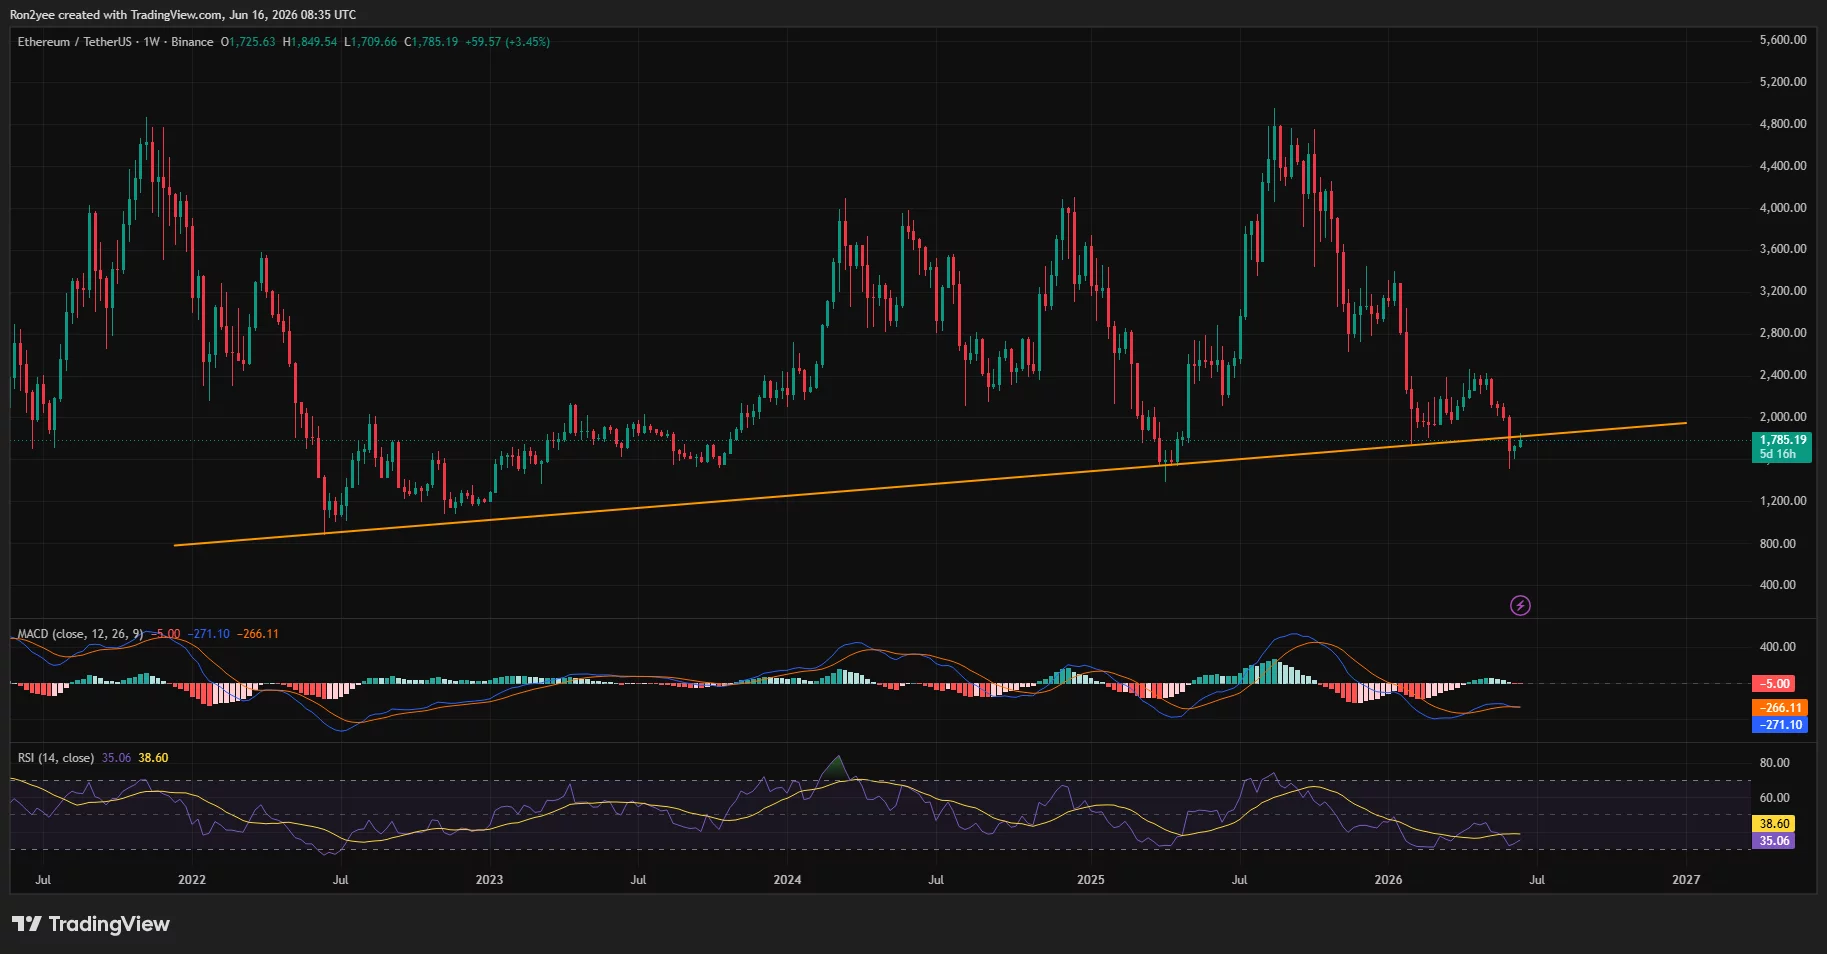
The weekly chart shows Ethereum once again testing an ascending support trendline that has connected major lows since 2022. Previous touches of the trendline preceded rallies toward $4,000 and above, making the current area one of the most important long-term technical zones on the chart.
On the daily timeframe, ETH has bounced from the June low near $1,507 and reclaimed the 78.6% Fibonacci retracement level at $1,712. The next resistance sits near the 61.8% level at $1,873, followed by the psychological $2,000 barrier and the 50% retracement zone around $1,986.
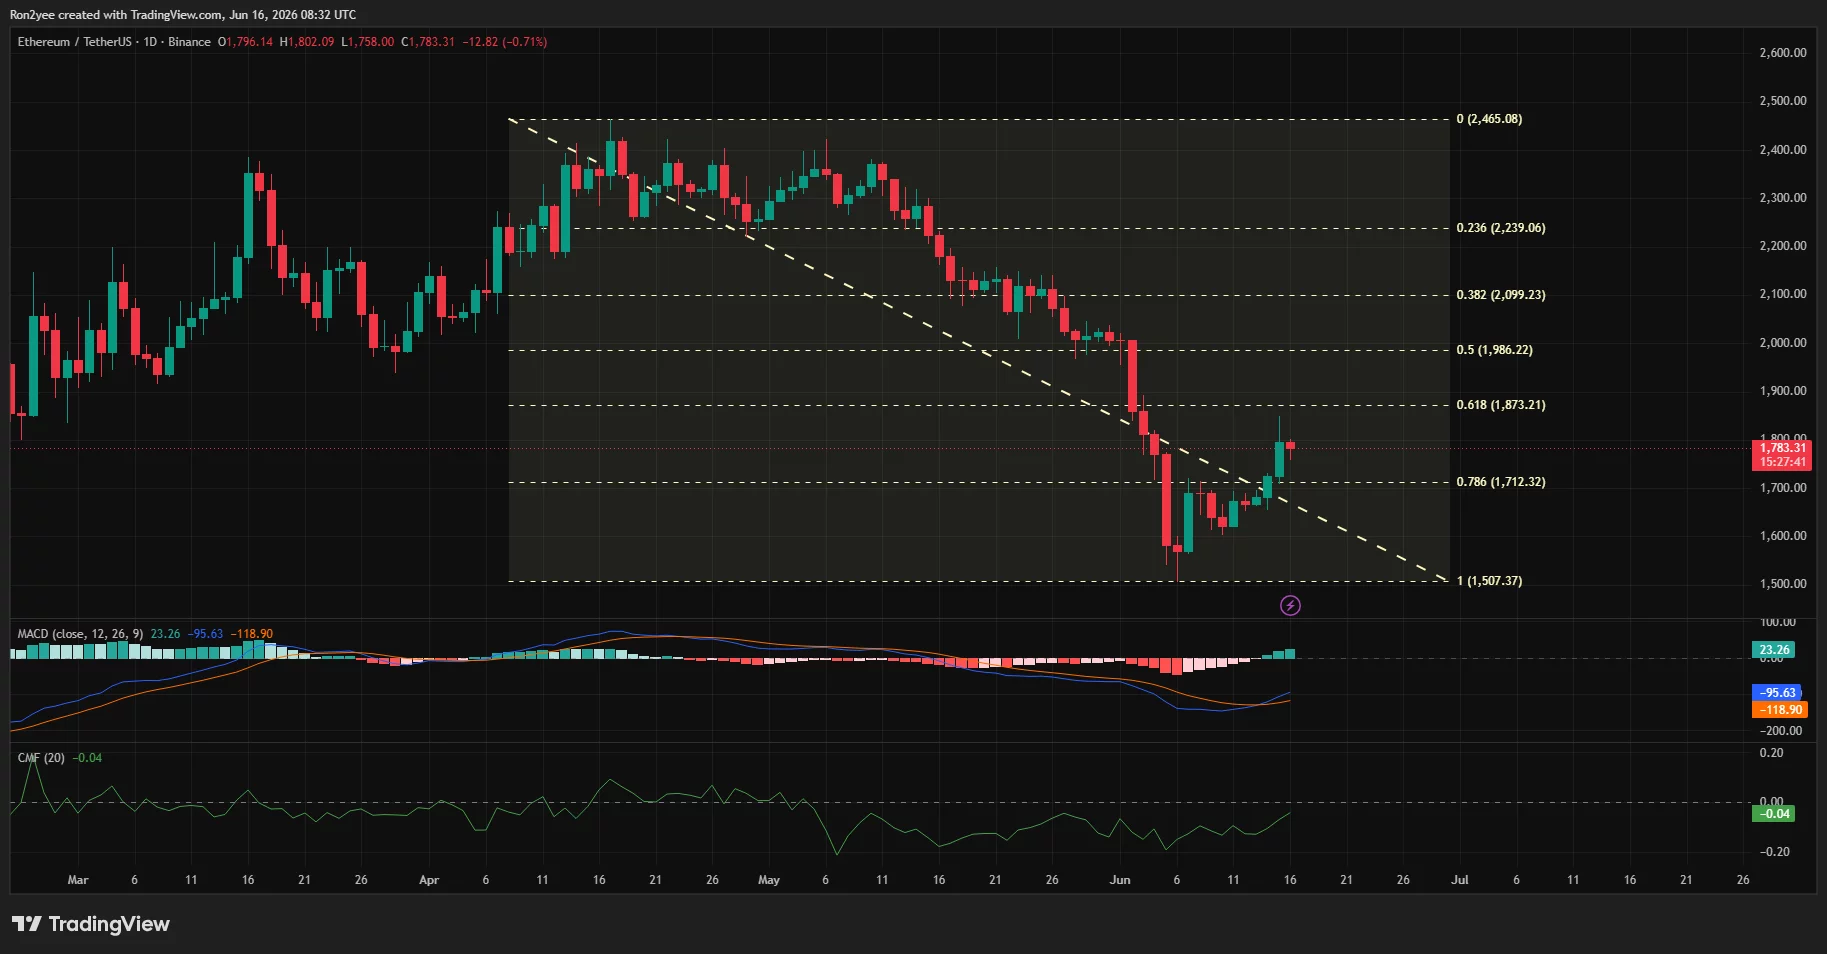
Momentum indicators have also improved. The daily MACD has completed a bullish crossover and moved higher from deeply negative territory, while the Chaikin Money Flow has recovered toward the neutral line after spending most of June below zero. Together, the indicators suggest selling pressure has eased compared with the first half of the month.
Market participants are closely watching whether ETH can convert the former breakdown area between $1,850 and $1,900 into support.
In a June 16 X post, analyst Michael van de Poppe noted that Ethereum is approaching a region that could form a higher low before a larger trend reversal.
A wall of short positions stands between ETH and $2,000
Derivatives data suggests volatility could increase if Ethereum approaches key resistance levels. CoinGlass liquidation heatmaps show a dense concentration of short liquidations between $1,840 and $1,860, with another major liquidity pocket sitting near $1,900. A move into those zones could force leveraged bears to cover positions and accelerate upside momentum.
The recent rally also appears to have trapped traders positioned for further downside. Ethereum’s recovery from the June lows coincided with a sharp reversal from oversold conditions, creating the conditions for a short squeeze as bearish bets were unwound.
Several risks remain. While President Donald Trump has said the U.S.-Iran peace agreement has already been signed, neither side has released the full text of the memorandum of understanding. Shipping companies continue to await greater clarity before resuming normal traffic through the Strait of Hormuz.
Any disruption to the implementation process could lift oil prices and renew inflation concerns ahead of upcoming Federal Reserve decisions.
From a technical perspective, the bullish setup weakens if Ethereum loses the multi-year trendline and falls back below $1,700. Such a move would expose the June low near $1,507 and reopen the possibility of a deeper retracement.
However, as of now, buyers have successfully defended long-term support, leaving the $1,873-$2,000 region as the next major test for Ethereum bulls.
Disclosure: This article does not represent investment advice. The content and materials featured on this page are for educational purposes only.


추천 콘텐츠

SpaceX Surges Past Microsoft to Become the World’s Fourth Most Valuable Company

Synopsys (SNPS) Stock Climbs on Murata Simulation Model Partnership

Hyperscale Data (GPUS) Stock Retreats After 77% Rally on Massive AI Data Center Agreement


인기 뉴스
더보기
