

Ethereum price today: Fear Index hits 23 as ETH holds $1,774

As of June 16, 2026, the Ethereum price today sits at $1,774.18 — a level caught between two competing forces. The daily chart remains unambiguously bearish, yet shorter timeframes hint that selling pressure may be exhausting itself. This is not a recovery yet, but the setup is worth examining.
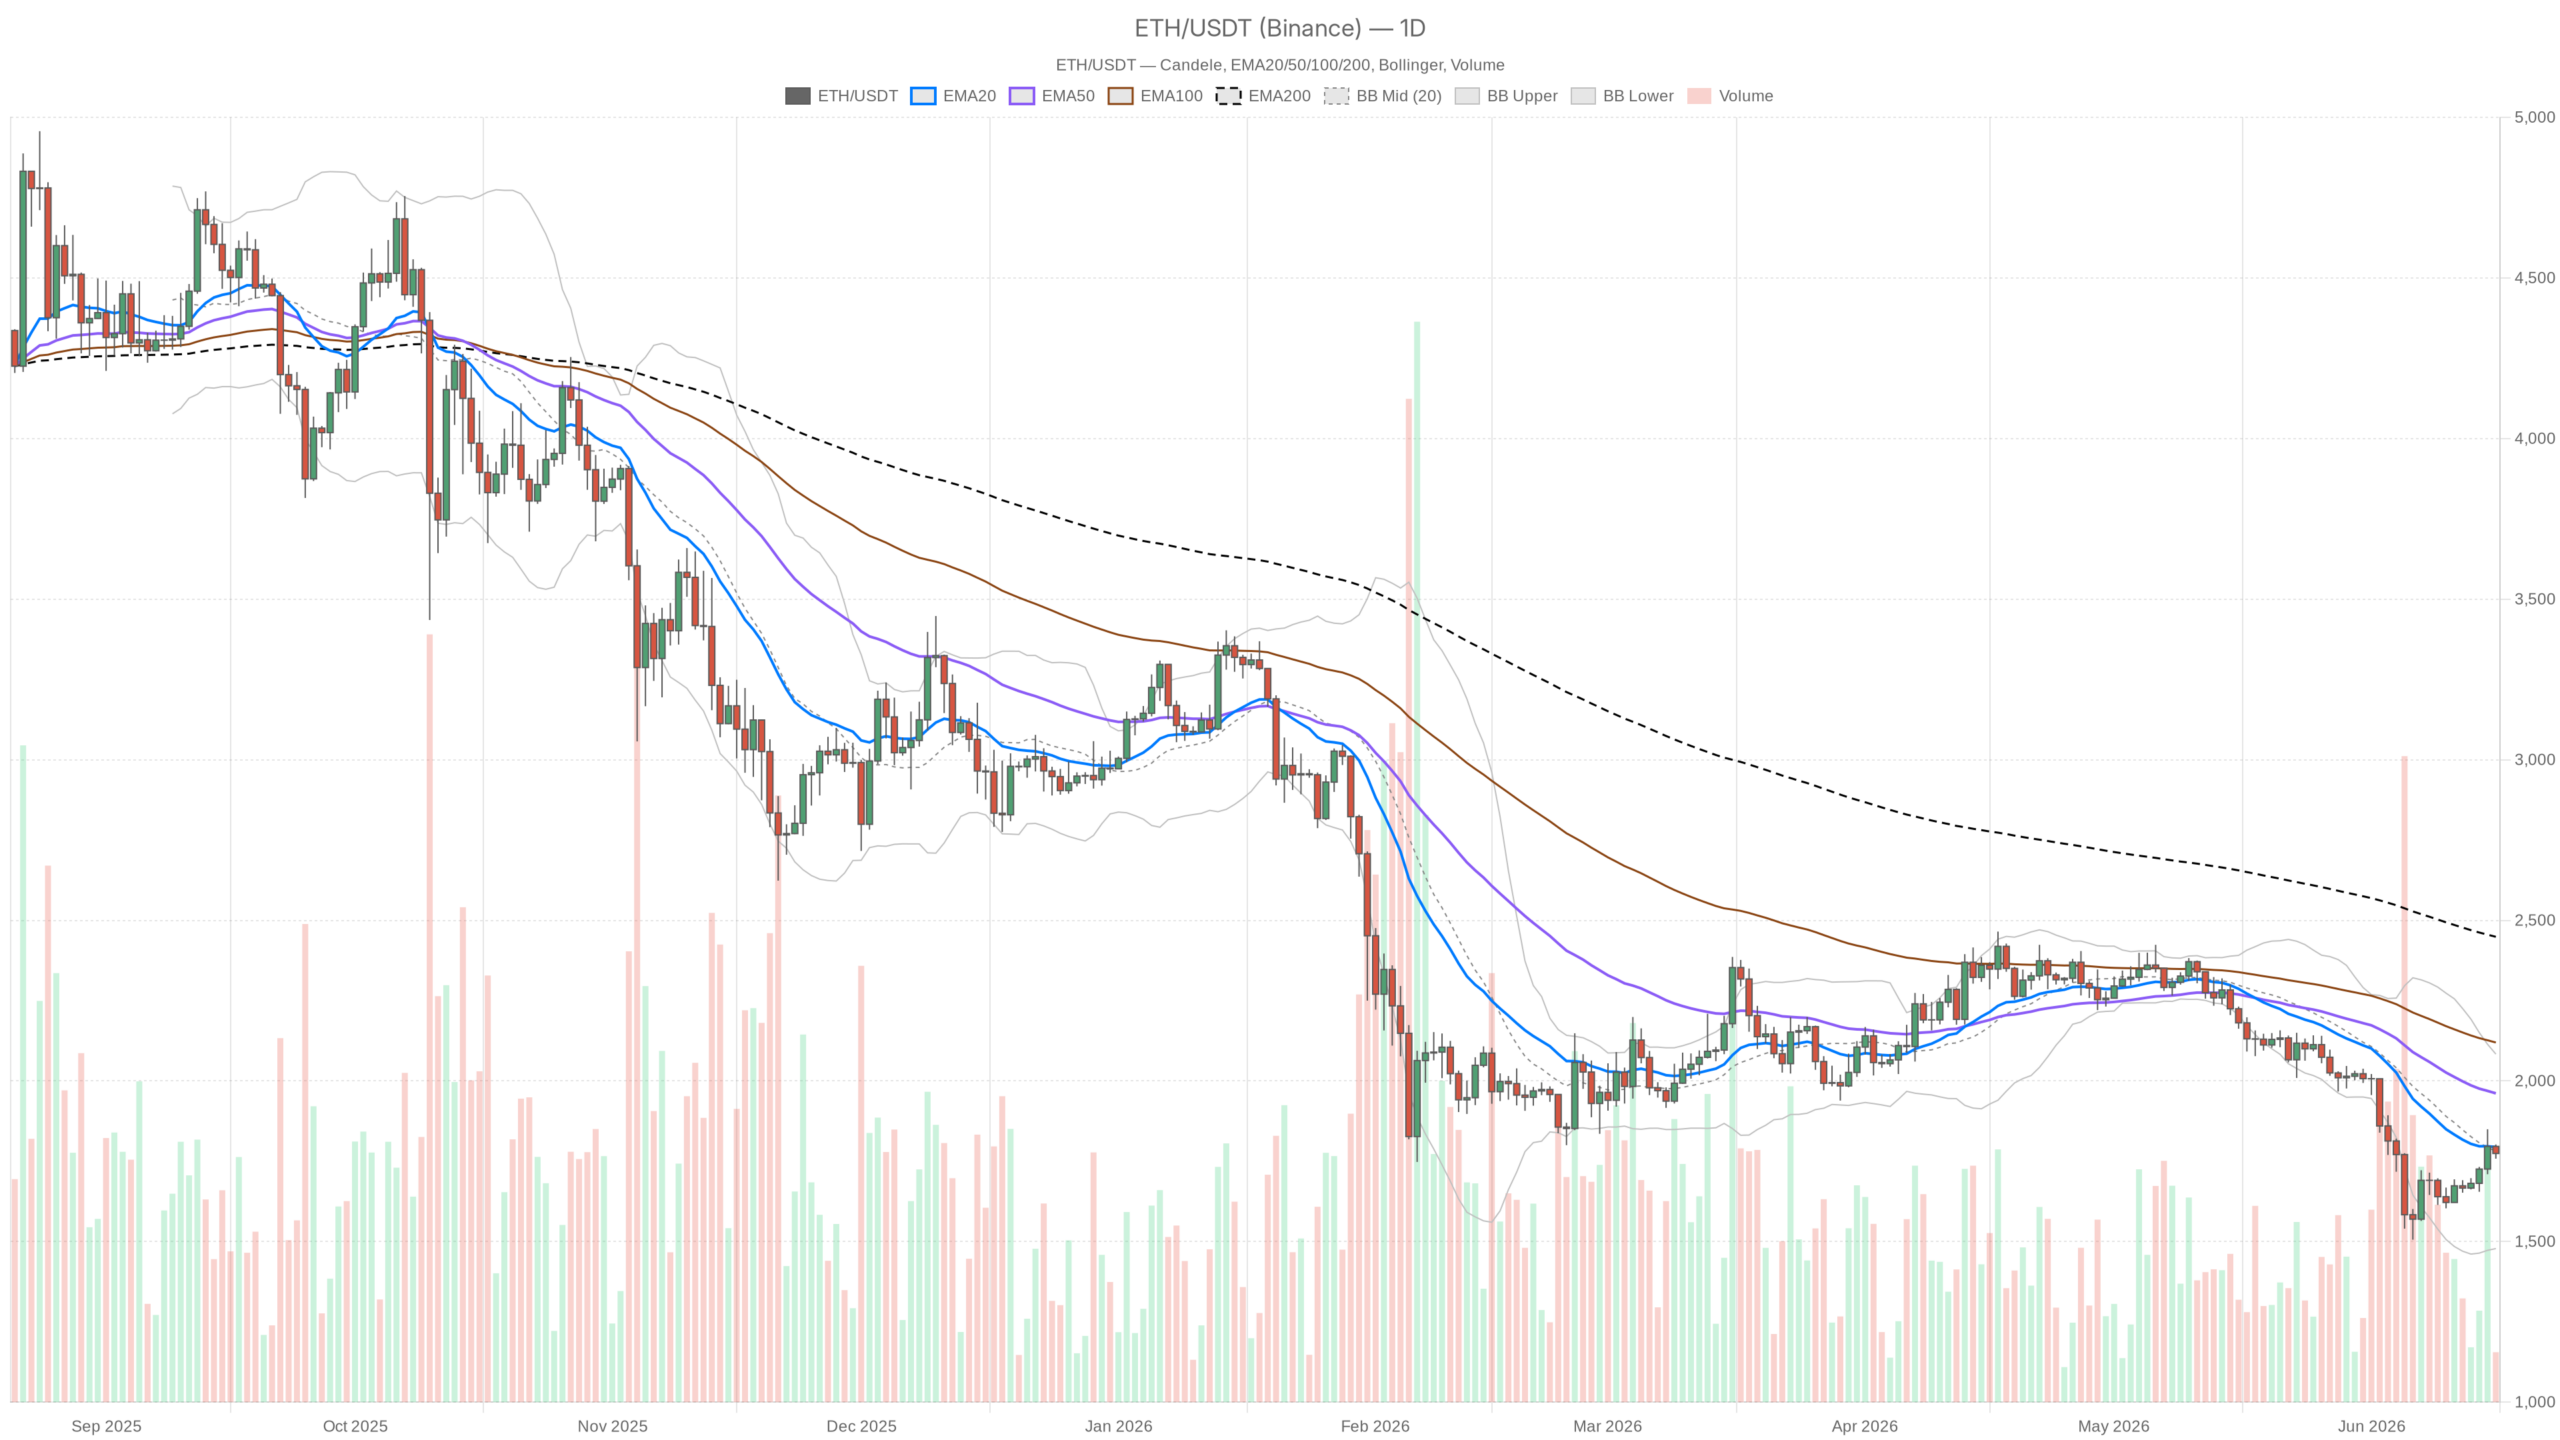 ETH/USDT — daily chart with candlesticks, EMA20/EMA50 and volume.
Key takeaways
- ETH trades at $1,774.18 on June 16, 2026, sitting below the 20-day, 50-day, and 200-day exponential moving averages in a clean bearish stack.
- The daily RSI reads 43.48, indicating there is room for further downside before oversold conditions trigger a potential bounce.
- The Crypto Fear & Greed Index sits at 23 (Extreme Fear), a zone that has historically preceded sharp directional moves in either direction.
- DEX fee activity on Uniswap V3 surged 168% in 24 hours, though elevated volume during fear-driven periods can reflect distribution rather than accumulation.
- A confirmed daily close above the 20-day EMA at $1,794 is the minimum technical requirement for any structural shift to take hold.
Context matters here. The broader crypto market cap sits at roughly $2.35 trillion according to CoinGecko data, up about 1.3% in the last 24 hours, with Bitcoin dominance holding firm at 56.5%. That is a telling statistic: capital is not rotating into altcoins yet. Ethereum’s share of the total market has slipped to just over 9%, confirming that ETH continues to underperform relative to Bitcoin in the current cycle. The Fear & Greed index is pinned at 23 — deep in Extreme Fear territory — which historically precedes sharp moves in either direction but more often rewards patience than aggression.
The daily chart: a bearish structure that has not broken down yet
The daily chart confirms a bearish structure, with ETH trading below every major moving average. At $1,774, ETH sits below its 20-day EMA ($1,794), below its 50-day EMA ($1,961), and dramatically below its 200-day EMA ($2,448). That is a clean bearish stack — every short- and long-term trend line sits above current price, acting as overhead resistance. Any rally attempt must climb through a wall of moving averages before a structural shift can even be considered.
Notably, the daily RSI at 43.48 sits in the lower half of its range without yet reaching the kind of oversold extremes that typically force capitulation bounces. It is the reading of a market that is tired, not panicked. There is room for further downside without RSI signaling a reversal — which is the uncomfortable truth bears will appreciate and bulls need to acknowledge.
The MACD on the daily tells a more nuanced story. The MACD line (-96.36) remains deeply negative and below the signal line (-119.04), confirming that downward momentum still dominates over the medium term. However, the histogram has turned positive at +22.68 — meaning momentum is decelerating. This does not signal an imminent reversal; it means the rate of decline is slowing. Sellers remain in control, but they are not pressing with the same aggression as before.
Meanwhile, Bollinger Bands on the daily frame the full picture: mid-band at $1,780, upper band at $2,083, lower band at $1,478. ETH is hugging the mid-band from below, which in a bearish trend typically acts as resistance rather than support. The band width itself suggests there is plenty of room for a move toward $1,478 if the floor gives way. The upper band near $2,083 represents a zone that seems distant given current structure. The daily ATR at $95.65 means that on an average day, ETH can swing nearly $100 — significant enough that intraday noise should not be confused for directional conviction.
At present, the daily pivot sits at $1,778.09, with R1 at $1,798 and S1 at $1,754. Price is essentially coiling around the pivot — neither side has made a decisive commitment.
The hourly chart: where the only glimmer of hope lives
The hourly chart offers a more constructive picture than the daily, though it remains neutral rather than bullish. The 50-hour EMA ($1,750) and 200-hour EMA ($1,700) are both below price, meaning ETH has reclaimed meaningful short-term levels. The 20-hour EMA at $1,778 is the immediate test — with price at $1,774 sitting just a few dollars below it.
Hourly RSI at 50.9 is the most balanced reading across any timeframe, sitting at the midpoint and genuinely undecided. The hourly MACD, however, leans negative: the line (6.91) is above zero but below the signal line (15.17), with the histogram printing -8.26. This suggests momentum is fading on the short-term bounce attempt. The hourly Bollinger mid at $1,799 with an upper band of $1,851 shows there is room to rally, but price has not yet found the energy to test those levels.
Ultimately, the key tension is this: the daily says stay short or flat, but the hourly says not actively selling lower right now. That disagreement is the market’s way of chopping up traders who overcommit in either direction.
The 15-minute frame: execution context only
On the 15-minute chart, price is essentially flat around the pivot at $1,774. The EMA20 ($1,772) and EMA50 ($1,781) are sandwiching price, and the RSI at 48.26 provides no directional edge. The MACD histogram has ticked positive at +2.15 — a minor improvement but nothing meaningful at this resolution. In practical terms, neither side has momentum right now. That makes it a poor time to chase and a reasonable time to wait for a break of the immediate structure: above $1,781 or below $1,757.
DeFi activity: volume is alive, but that is not the same as price recovery
One data point worth noting: DEX fee activity on Ethereum-native protocols has spiked sharply. Uniswap V3 saw fees jump 168% in the last 24 hours, while Fluid DEX posted an eye-catching +192% single-day move according to DefiLlama figures. On the surface this looks bullish — high DEX activity implies on-chain engagement. But context is everything: a 107% spike in 24-hour trading volume across the total market, per CoinGecko, suggests that much of this activity is driven by volatility rather than a healthy influx of new capital. People trading more does not always mean people are buying. In periods of fear, elevated volume can reflect distribution or panic just as easily as accumulation.
The bullish scenario
For bulls to gain any structural credibility, ETH needs to close above the 20-day EMA at $1,794 on a daily basis — not touch it intraday, but close there cleanly. That would be the first step toward neutralizing the immediate downtrend. Beyond that, reclaiming $1,850–$1,900 would bring the 50-day EMA back into play as a viable target rather than a distant hope. The MACD histogram already showing improvement on the daily is a precondition for this scenario playing out. If momentum continues to decelerate and eventually crosses into positive territory, the setup for a bounce becomes technically legitimate. Invalidation is simple: a daily close back below $1,730 would suggest the current consolidation was just a pause in the broader decline.
The bearish scenario
Bears have the structural advantage. As long as price stays below the daily EMA20, the burden of proof rests on bulls. A break below the S1 pivot at $1,754 — especially if it coincides with a reversal on the hourly — opens the door toward the Bollinger lower band around $1,478 on the daily. That is not a prediction, but it is the natural target if support gives way. Conversely, an RSI pushing into the 30s on the daily, combined with a MACD histogram rolling back negative, would confirm the bearish thesis. The bullish scenario is invalidated once ETH posts a weekly close below $1,700. At that point, the hourly EMA200 which currently sits at $1,700 becomes the last line before a more meaningful structural breakdown.
Positioning and risk
This is not a market that rewards binary conviction. While the Ethereum price today reflects a bearish daily structure, the hourly chart shows the downtrend is not accelerating right now. Those two things can be true simultaneously, and the right response is usually to narrow risk exposure rather than double down on either side. The ATR of nearly $96 on the daily means that a position sized for a $50 stop is already operating inside the noise. In a Fear & Greed environment at 23, markets tend to have violent two-way swings before establishing direction — the kind of moves that stop out both longs and shorts before the real trend resumes. Patience here is not timidity; it is edge management. What the market needs to show is either a confirmed daily reclaim of $1,800 or a clear breakdown below $1,750 on volume. Until one of those things happens, this is a market best observed more than traded.
FAQ
What is Ethereum’s price today, and where does it stand technically?
As of June 16, 2026, Ethereum trades at $1,774.18, positioned below its 20-day EMA ($1,794), 50-day EMA ($1,961), and 200-day EMA ($2,448). This clean bearish stack means every major moving average acts as overhead resistance.
Is Ethereum’s current trend bearish or bullish?
The daily chart structure is unambiguously bearish. ETH trades below every major moving average, the daily RSI sits at 43.48, and the MACD line remains deeply negative. However, the hourly chart shows a neutral short-term stance, suggesting the downtrend is not accelerating right now.
What level does Ethereum need to reclaim for a trend reversal?
For any structural shift to become credible, ETH must achieve a clean daily close above the 20-day EMA at $1,794. Beyond that, reclaiming the $1,850–$1,900 zone would bring the 50-day EMA into play as a viable medium-term target.
Disclaimer: This article is for informational purposes only and does not constitute financial advice, an investment recommendation, or a solicitation to buy or sell any financial instrument or cryptocurrency. The analysis provided is not indicative of future results. Investing in crypto assets and financial markets carries a high risk of capital loss. Always do your own research (DYOR) and consult a qualified financial advisor before making any decision.
Article produced with the assistance of artificial intelligence and reviewed by the editorial team.


추천 콘텐츠

Humanity to Scrap Old H Tokens, Airdrop New ERC-20 Version at 1:1 Ratio After Hack

How to Earn Free Cryptocurrency in 2026?

USA World Cup 2026 Guide: Host Nation Schedule, Squad, Key Players and Prediction Outlook


인기 뉴스
더보기
