

BTC Spot CVD Chart Analysis: Order Flow and Volume Heatmap Insights for June 16
BitcoinWorld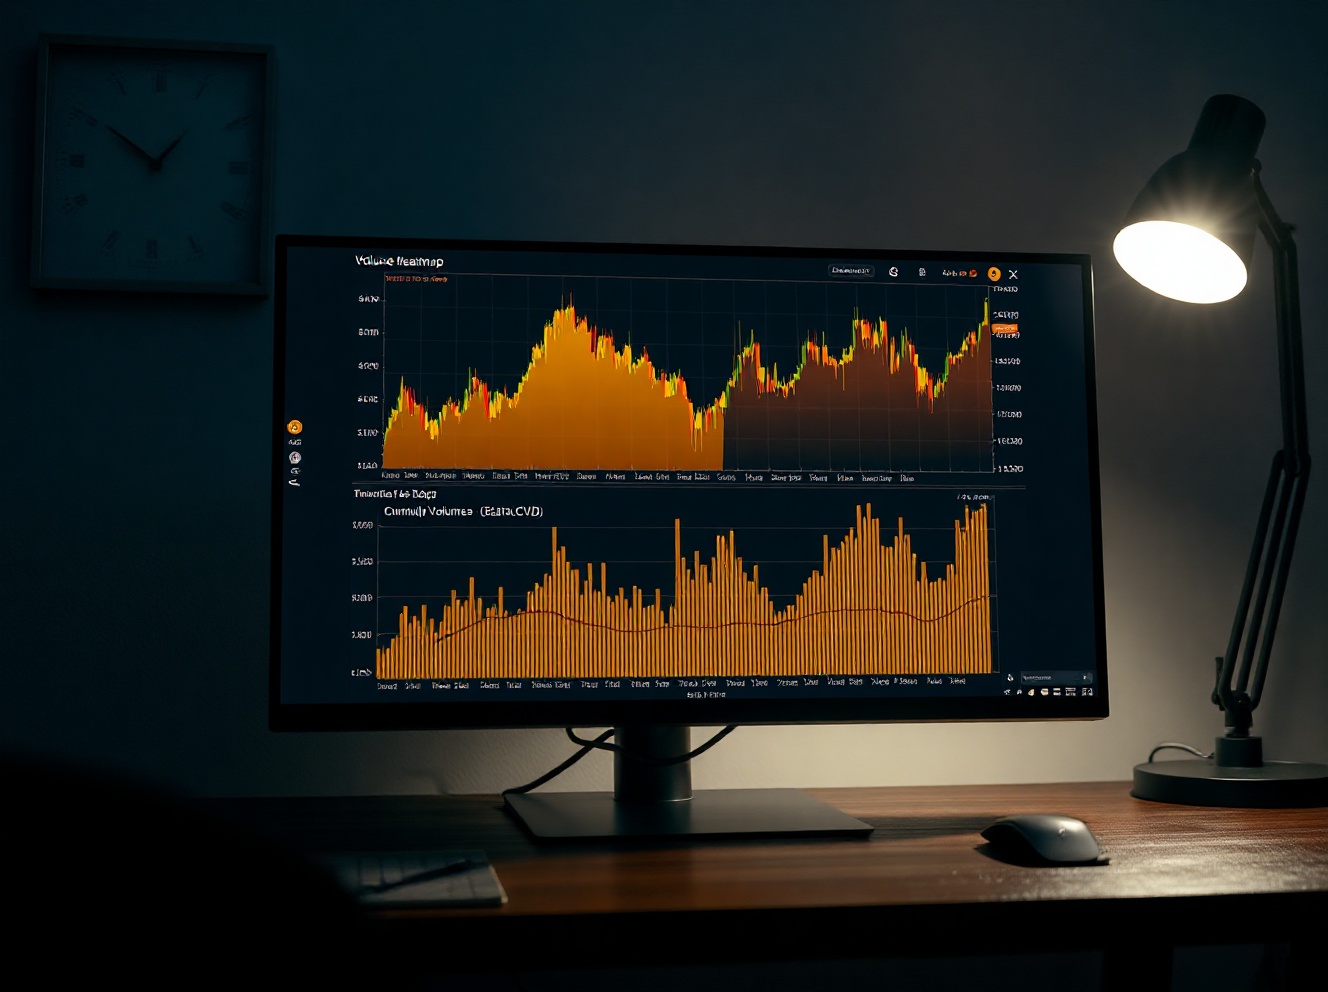
BTC Spot CVD Chart Analysis: Order Flow and Volume Heatmap Insights for June 16
On June 16, the spot Cumulative Volume Delta (CVD) chart for the BTC/USDT trading pair offered traders a detailed look at order book dynamics. The chart, which tracks the difference between buying and selling pressure at each price level, is a key tool for understanding market microstructure. This analysis breaks down the two primary components of the chart: the Volume Heatmap and the CVD indicator, and explains what they signal for Bitcoin’s price action.
Understanding the Volume Heatmap
The top section of the chart features a Volume Heatmap, which visualizes the intensity of trading activity at specific price levels. Brighter areas on the heatmap indicate where the price has either remained for an extended period or where a significant move occurred. These zones often act as potential support or resistance levels, as they represent price points where a large number of trades were executed. For traders monitoring the June 16 data, these highlighted regions can help identify where the market may pause or reverse.
Interpreting the Cumulative Volume Delta (CVD)
The lower portion of the chart displays the Cumulative Volume Delta, which categorizes buy and sell orders by trade size. When buy orders dominate at a given price level, the corresponding line on the CVD rises. The chart uses color-coded lines to represent different order sizes: the yellow line tracks orders between $100 and $1,000, typically associated with retail traders, while the brown line represents large orders ranging from $1 million to $10 million, often linked to institutional activity. A divergence between these lines can signal shifts in market sentiment.
What the Data Suggests for Bitcoin
For the period around 12:00 a.m. UTC on June 16, the CVD chart provides a snapshot of order flow that can be used to gauge short-term momentum. A rising CVD, especially in the brown line, suggests that large buyers are accumulating, which may indicate confidence in higher prices. Conversely, a decline could point to distribution or profit-taking by large holders. Traders often combine this data with other indicators to confirm trends or identify potential reversals.
Why This Matters for Traders
The spot CVD chart is a valuable tool for understanding real-time supply and demand dynamics. Unlike simple price charts, it reveals the actual volume behind price movements, helping traders distinguish between genuine buying pressure and market noise. For those trading the BTC/USDT pair, monitoring the CVD alongside the Volume Heatmap can improve entry and exit timing, particularly during periods of low liquidity or high volatility.
Conclusion
The BTC spot CVD chart for June 16 offers actionable insights into order flow and market structure. By analyzing the Volume Heatmap and the CVD indicator, traders can better understand where liquidity is concentrated and whether large players are accumulating or distributing. As always, this data should be used as part of a broader trading strategy rather than in isolation.
FAQs
Q1: What does the Cumulative Volume Delta (CVD) measure?
The CVD measures the net difference between buying and selling volume at each price level. A positive CVD indicates more buying pressure, while a negative CVD suggests selling pressure.
Q2: How is the Volume Heatmap different from a standard price chart?
The Volume Heatmap shows the intensity of trading activity at specific price levels over time, highlighting areas where the price has stalled or made large moves. This helps identify potential support and resistance zones.
Q3: Why are trade size categories important in CVD analysis?
Different trade sizes can indicate the type of market participant. Small orders (e.g., $100–$1,000) are often retail traders, while large orders ($1M–$10M) suggest institutional activity. Tracking both can reveal shifts in market sentiment.
This post BTC Spot CVD Chart Analysis: Order Flow and Volume Heatmap Insights for June 16 first appeared on BitcoinWorld.


추천 콘텐츠

Tariffs are only generating 25% of the revenue needed to pay interest on national debt—despite pitch that it would be a silver bullet

Robotics Automation Prototyping: Engineering Kinetic Agility into End-Effectors
Best Semiconductor Stocks


인기 뉴스
더보기
