

Bitcoin (BTC) Gears Up for Its Next Move: Is a Major Bullish Phase Around the Corner?
- Bitcoin price is trading at the $66K mark.
- If momentum holds, this region is BTC’s next major resistance target.
Bitcoin has finally reclaimed and broken above the key $64,360 resistance level, a zone that had capped price advances over the past several sessions. The chart shows multiple failed attempts to push through this level, making the latest breakout significant from a technical standpoint.
The sequence of higher lows that developed along the rising trendline is noteworthy because it shows that buyers were gradually entering the market at increasing prices. The short-term acquisition of control by buyers is confirmed by the breakout above resistance.
The next significant level to keep an eye on is about $67,630. If the current momentum holds, this region might become Bitcoin’s immediate target as it is the next major resistance. The bullish structure would be strengthened by a persistent advance above $64,360.
The power of the move would be strengthened if $64,360 moved from resistance to support. The path of least resistance seems to be upward as long as the price stays above this level, with $67,630 looming as the next important upside target.
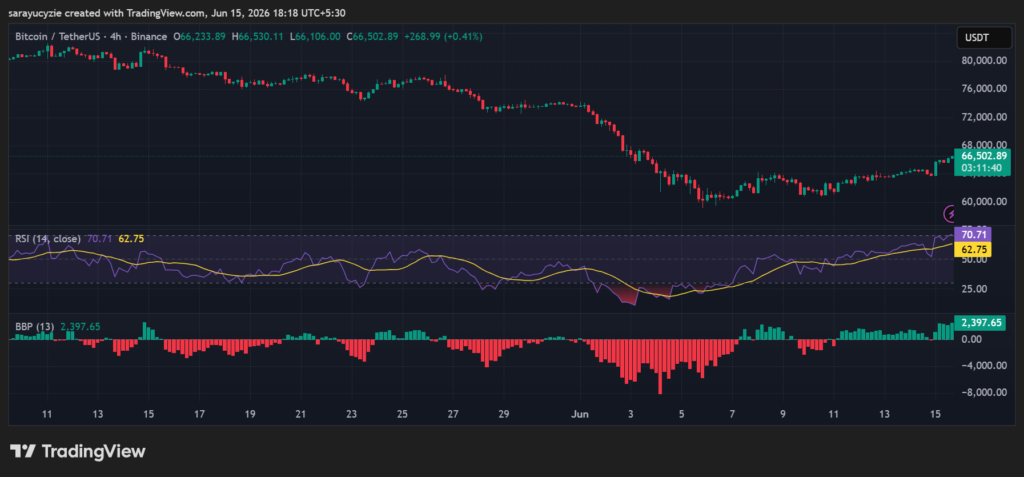
Additionally, following a surge of more than 2.60%, the price of Bitcoin is currently $66,153. The asset’s price began the day at a low of $63,634 and reached a high of $66,297. At $28.92 billion, the trade volume has increased by more than 72%. Meanwhile, the BTC Fear and Greed Index value is settled at 20, which indicates extreme fear.
What’s Next for Bitcoin’s Price Trend?
According to the price chart, the price may challenge the $65,792 support if the BTC bears get stronger. A more intensified downside may initiate the death cross to emerge and drive the price even lower. On the upside, assuming the Bitcoin bulls gain momentum, the price could climb to the resistance at $66,421. The golden cross might form with the potential bullish correction.
The MACD line is above the signal line, and both are above the zero line, signalling strong bullish momentum. Both short and long-term momentum are aligned to the upside. Moreover, BTC’s CMF value at 0.27 indicates strong buying pressure and healthy capital inflows. Buyers are actively accumulating the asset and supporting the current uptrend.
 (Source: TradingView)
Bitcoin’s BBP reading of 2,397 reflects strong bullish pressure. The buyers are dominating the market, pushing the price far above its average. The trend is still firmly under the bulls’ grip. Additionally, the daily RSI has entered the overbought zone at 70.71. Traders keep an eye out for consolidation or a brief decline at these levels, even though the rally may continue.
Crypto Market Highlights
$4.93M in Profit and a 90% Win Rate: Ethereum Whale Makes Big Moves as ETH Holds $1.7K


추천 콘텐츠
DCodex Officially Launches DPay, a Visa-Powered USDT Payment Card Bridging Crypto Assets and Real-World Spending

Western Digital Jumps 7% on Morgan Stanley’s 33% Price-Target Hike, Seagate Gains 5% as the AI Storage Boom Rolls On

Mitch Gould: Decades of Retail Experience Position Him as a Leading Voice in Sports Nutrition Market


인기 뉴스
더보기
