

Ripple price today at $1.18: Fear Index at 20, bearish daily and risk at $1.04
The Ripple price today stands at 1.18 USDT, stuck at the level that, more than any indicator, tells the story of the ongoing clash. It is the point where two opposing forces face off without resolution: the daily shows a deteriorated structure, while the intraday hints at a fragile bullish push.
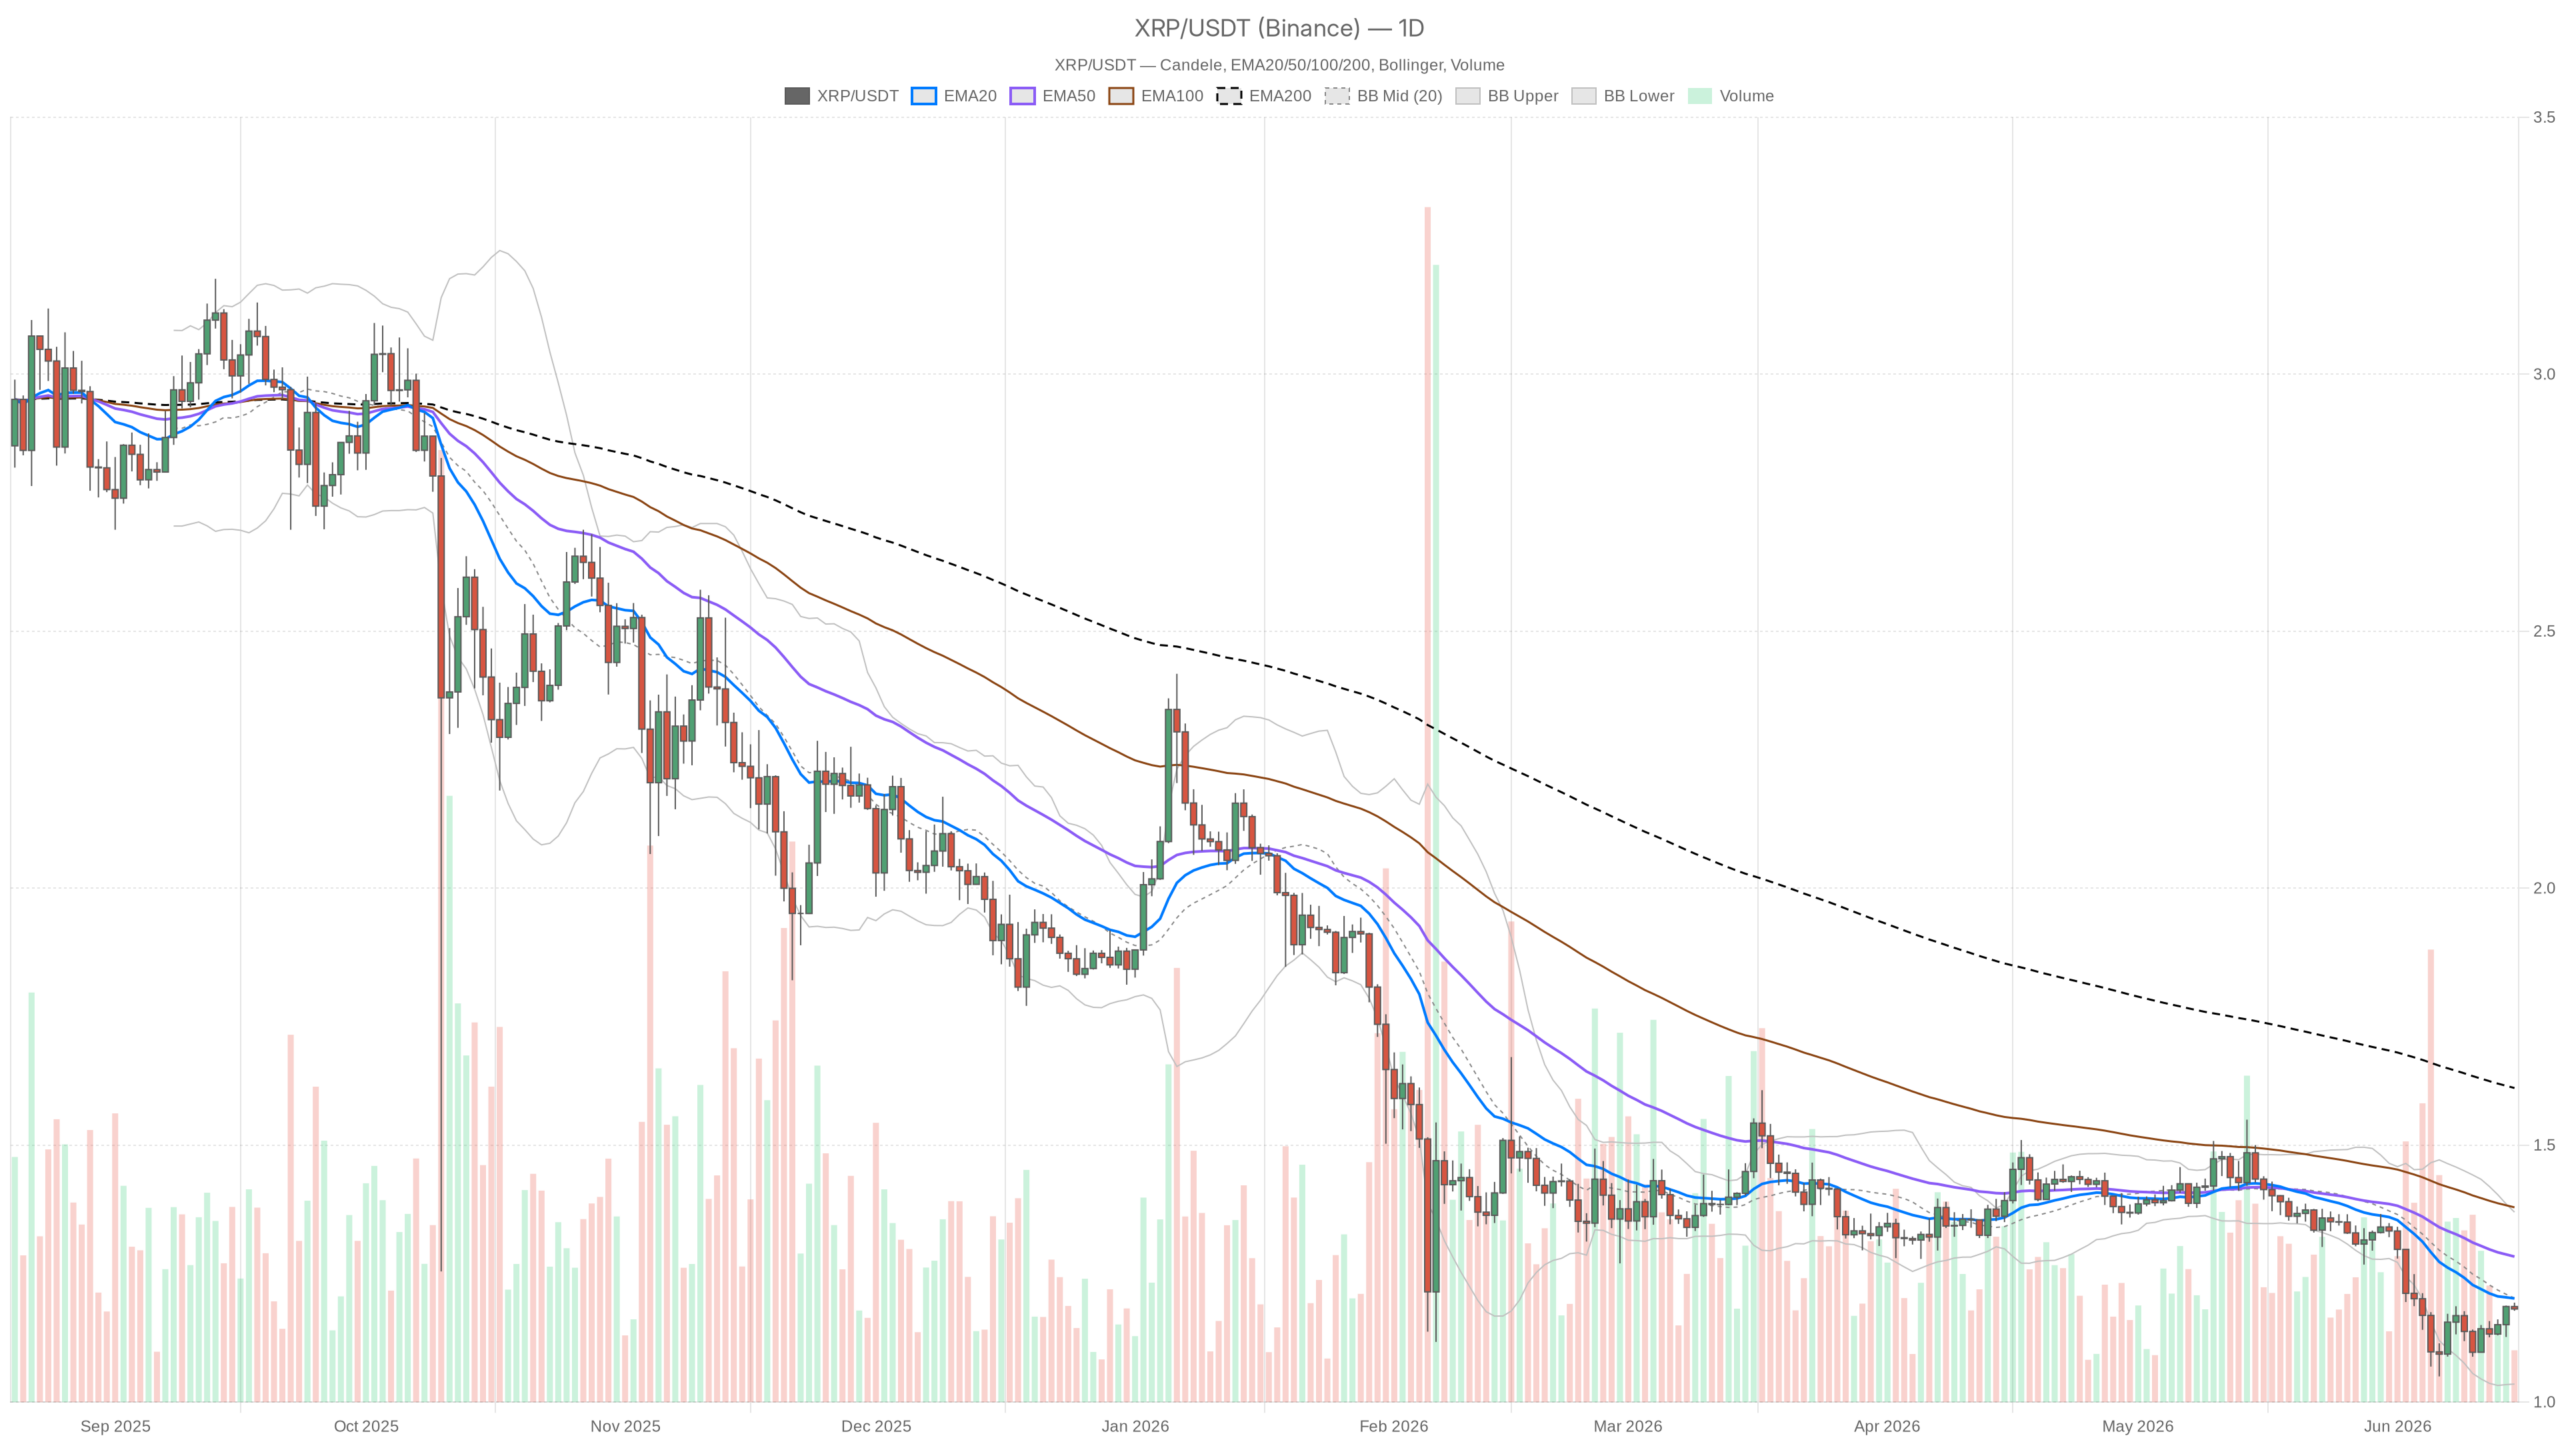 XRP/USDT — daily chart with candles, EMA20/EMA50 and volumes.
Key points
- XRP trades at 1.18 USDT, below EMA20 and EMA50 on the daily timeframe
- Daily RSI at 43.31, in an area of potential further weakness
- Pivot support S1 at 1.17 USDT and key resistance at 1.20 USDT
- Fear & Greed Index at 20, Extreme Fear level
- Timeframe conflict: H1 technically bullish, daily still bearish
The underlying structure: a bearish trend that has not yet capitulated
As of 15 June 2026, looking at the daily timeframe, the picture is unequivocal: XRP is in a bearish regime. The current value of 1.18 USDT is below both the EMA20 at 1.20 and the EMA50 at 1.28, with the EMA200 far away at 1.61. The price is not simply consolidating below the moving averages: it is suffering them as dynamic resistances, and this radically changes the weight to be given to any short-term bounce.
The daily RSI at 43.31 is not yet in a technically oversold area, but it is in a range that historically precedes two scenarios: further weakness towards 30–35, or an attempted recovery that, however, finds the wall of the moving averages. The current structure suggests the former more than the latter, at least until there is a convincing daily close above 1.20.
The daily MACD is clear: line at -0.05, signal at -0.06, with the histogram slightly positive at +0.01. This small uptick in the histogram might look like a reversal signal, but in a context where both lines are deeply negative, it represents more a deceleration of weakness than a true momentum reversal. It is not enough to build a bullish thesis on the daily.
Bollinger Bands and ATR: compressed volatility, latent risk
The Bollinger Bands on the daily show an upper band at 1.37 and a lower band at 1.04, with the price trading slightly below the middle band at 1.20. This positioning indicates that XRP is not in an oversold condition on the daily, which removes arguments of the “technical bounce from extremes” type. There is still room to the downside before touching the lower band, and this level should be kept in mind as a bearish target.
The daily ATR at 0.06 indicates medium-low volatility. In practical terms, expected daily swings are around 5 cents, making intraday moves less significant than they might appear. However, according to available market data, this volatility compression tends to precede more directional moves, but the direction remains to be determined.
The pivot point and the equilibrium zone
The daily pivot levels confirm the suspended nature of the situation: PP at 1.18, R1 at 1.19, S1 at 1.17. A range of just 2 cents between pivot support and resistance says everything about the lack of short-term directionality. The price is literally in the middle, without a sufficient technical catalyst to push it decisively in one direction.
The intraday tells a different story
Switching to H1, the picture changes tone. The regime is classified as bullish, with the price at 1.18 trading above all three hourly moving averages: EMA20 at 1.17, EMA50 at 1.16, EMA200 at 1.15. This configuration, with the averages in ascending order, is technically constructive. However, this strength is developing within a negative daily trend, which makes it fragile by definition.
The H1 RSI at 67.89 deserves attention. It is not yet in technical overbought, but it is close. In a context where the daily is pressing downward, an hourly RSI that touches 70 often acts as an exhaustion zone for the bounce rather than a continuation signal. If in the next hourly candles the RSI were to exceed 70 and then fall back, it would be a signal to monitor closely.
On the 15-minute chart, instead, everything is quiet. The MACD is flat, the ATR is practically zero, the Bollinger Bands are maximally compressed with upper and lower almost coinciding. The price is in absolute equilibrium in the very short term. This kind of extreme compression on the 15m, in the presence of an H1 close to overbought and a daily in a bearish regime, increases the risk of an impulsive, unpredictable move.
The macro context does not help the bulls
The Fear & Greed Index is at 20, classified as Extreme Fear. Historically, this data is associated with phases of capitulation or maximum bearish pressure. It is not necessarily an immediate buy signal: markets can remain in extreme fear for weeks. Bitcoin dominance at 56.6% indicates that capital continues to seek refuge in the main digital asset, draining liquidity from altcoins like XRP. The total crypto market capitalization is around 2.33 trillion dollars with an increase of 1.9% in the last 24 hours: a mixed signal, positive but not enough to change the bearish narrative for an already weak asset like XRP at this time.
Bullish scenario: the conditions for a recovery
For XRP to build a credible reversal, a daily close above 1.20 USDT is needed, a level that coincides with the EMA20 and the middle band of the Bollinger Bands. That level is the first real dynamic resistance to overcome. Consolidation above 1.20 with rising volume would open the way towards 1.28, which would become the second test. In this scenario, the daily RSI should climb back above 50 to confirm a true momentum shift. The scenario is invalidated if the price, after breaking above 1.20, falls back below that level on the daily close.
Bearish scenario: what would happen if 1.17 gave way
The pivot support S1 at 1.17 USDT is the first level to watch. A close below 1.17 on H1, in a context where the daily is already bearish and H1 is losing momentum, would open the way towards 1.10 and subsequently towards 1.04 USDT. The lower band of the daily Bollinger Bands at 1.04 represents the natural target in this scenario. Invalidation is simple: if the price bounces strongly from 1.17 and the daily RSI starts to rise, the bearish scenario loses immediate credibility.
How to read this moment operationally
The current situation of XRP is the classic case of timeframe conflict, and this should impose caution. Those operating in the short term, with reference to H1, might see a still-supported structure, but the overhead resistance from the daily is heavy and should not be ignored. Those with a broader horizon still do not have sufficient signals to talk about a reversal: the Ripple price today at 1.18 USDT has not yet produced any relevant technical breakout.
The main risk at this time is the false signal: H1 close to overbought could generate a small breakout above 1.19–1.20 that attracts buyers, only to then fall back below the moving averages. The Ripple market, at this stage, rewards patience and punishes haste. Before taking a position in any direction, it is worth waiting for one of the two levels, 1.20 to the upside or 1.17 to the downside, to be tested and to respond with a clear candle.
FAQ
Is XRP in a bullish or bearish trend?
On the daily timeframe, XRP is in a bearish regime. The price is below EMA20, EMA50 and EMA200, with daily RSI at 43.31 and MACD still negative. Only a daily close above 1.20 USDT could start to change this configuration.
What are the key levels to watch for XRP?
The main levels are 1.20 USDT as dynamic resistance and 1.17 USDT as pivot support S1. A break of 1.17 would open the way towards 1.10–1.04, while a move above 1.20 with volume could target 1.28.
Is the Fear & Greed Index at 20 a buy signal?
Not necessarily. The Fear & Greed Index at 20 indicates Extreme Fear, a condition that historically accompanies phases of bearish pressure. Markets can remain in this zone for weeks before a reversal, so it does not in itself constitute an immediate operational signal.
{“@context”:”https://schema.org”,”@type”:”FAQPage”,”mainEntity”:[{“@type”:”Question”,”name”:”Is XRP in a bullish or bearish trend?”,”acceptedAnswer”:{“@type”:”Answer”,”text”:”On the daily timeframe, XRP is in a bearish regime. The price is below EMA20, EMA50 and EMA200, with daily RSI at 43.31 and MACD still negative. Only a daily close above 1.20 USDT could start to change this configuration.”}},{“@type”:”Question”,”name”:”What are the key levels to watch for XRP?”,”acceptedAnswer”:{“@type”:”Answer”,”text”:”The main levels are 1.20 USDT as dynamic resistance and 1.17 USDT as pivot support S1. A break of 1.17 would open the way towards 1.10–1.04, while a move above 1.20 with volume could target 1.28.”}},{“@type”:”Question”,”name”:”Is the Fear & Greed Index at 20 a buy signal?”,”acceptedAnswer”:{“@type”:”Answer”,”text”:”Not necessarily. The Fear & Greed Index at 20 indicates Extreme Fear, a condition that historically accompanies phases of bearish pressure. Markets can remain in this zone for weeks before a reversal, so it does not in itself constitute an immediate operational signal.”}}]}
Disclaimer: This article is for informational purposes only and does not constitute financial advice, investment recommendation or a solicitation to buy or sell financial instruments or cryptocurrencies. The analyses do not guarantee future results. Investments in crypto-assets and financial markets involve a high risk of capital loss. Always do your own research (DYOR) and consult a qualified financial advisor before making any decision.
Content created with the assistance of artificial intelligence and with human editorial review.


추천 콘텐츠

Synopsys (SNPS) Stock Climbs on Murata Simulation Model Partnership

Hyperscale Data (GPUS) Stock Retreats After 77% Rally on Massive AI Data Center Agreement

Franklin Templeton CEO Dismisses 50bps Rate Cut Ahead FOMC


인기 뉴스
더보기
