

Can Alphabet Stock Break $363? Dow Inclusion Adds New Buyer Base
Alphabet stock enters July in a structurally constructive position. GOOGL closed at $361.21 on July 1st, above its daily pivot of $360.20 and key moving averages. The daily regime reads bullish, though hourly caution tempers the near-term outlook.
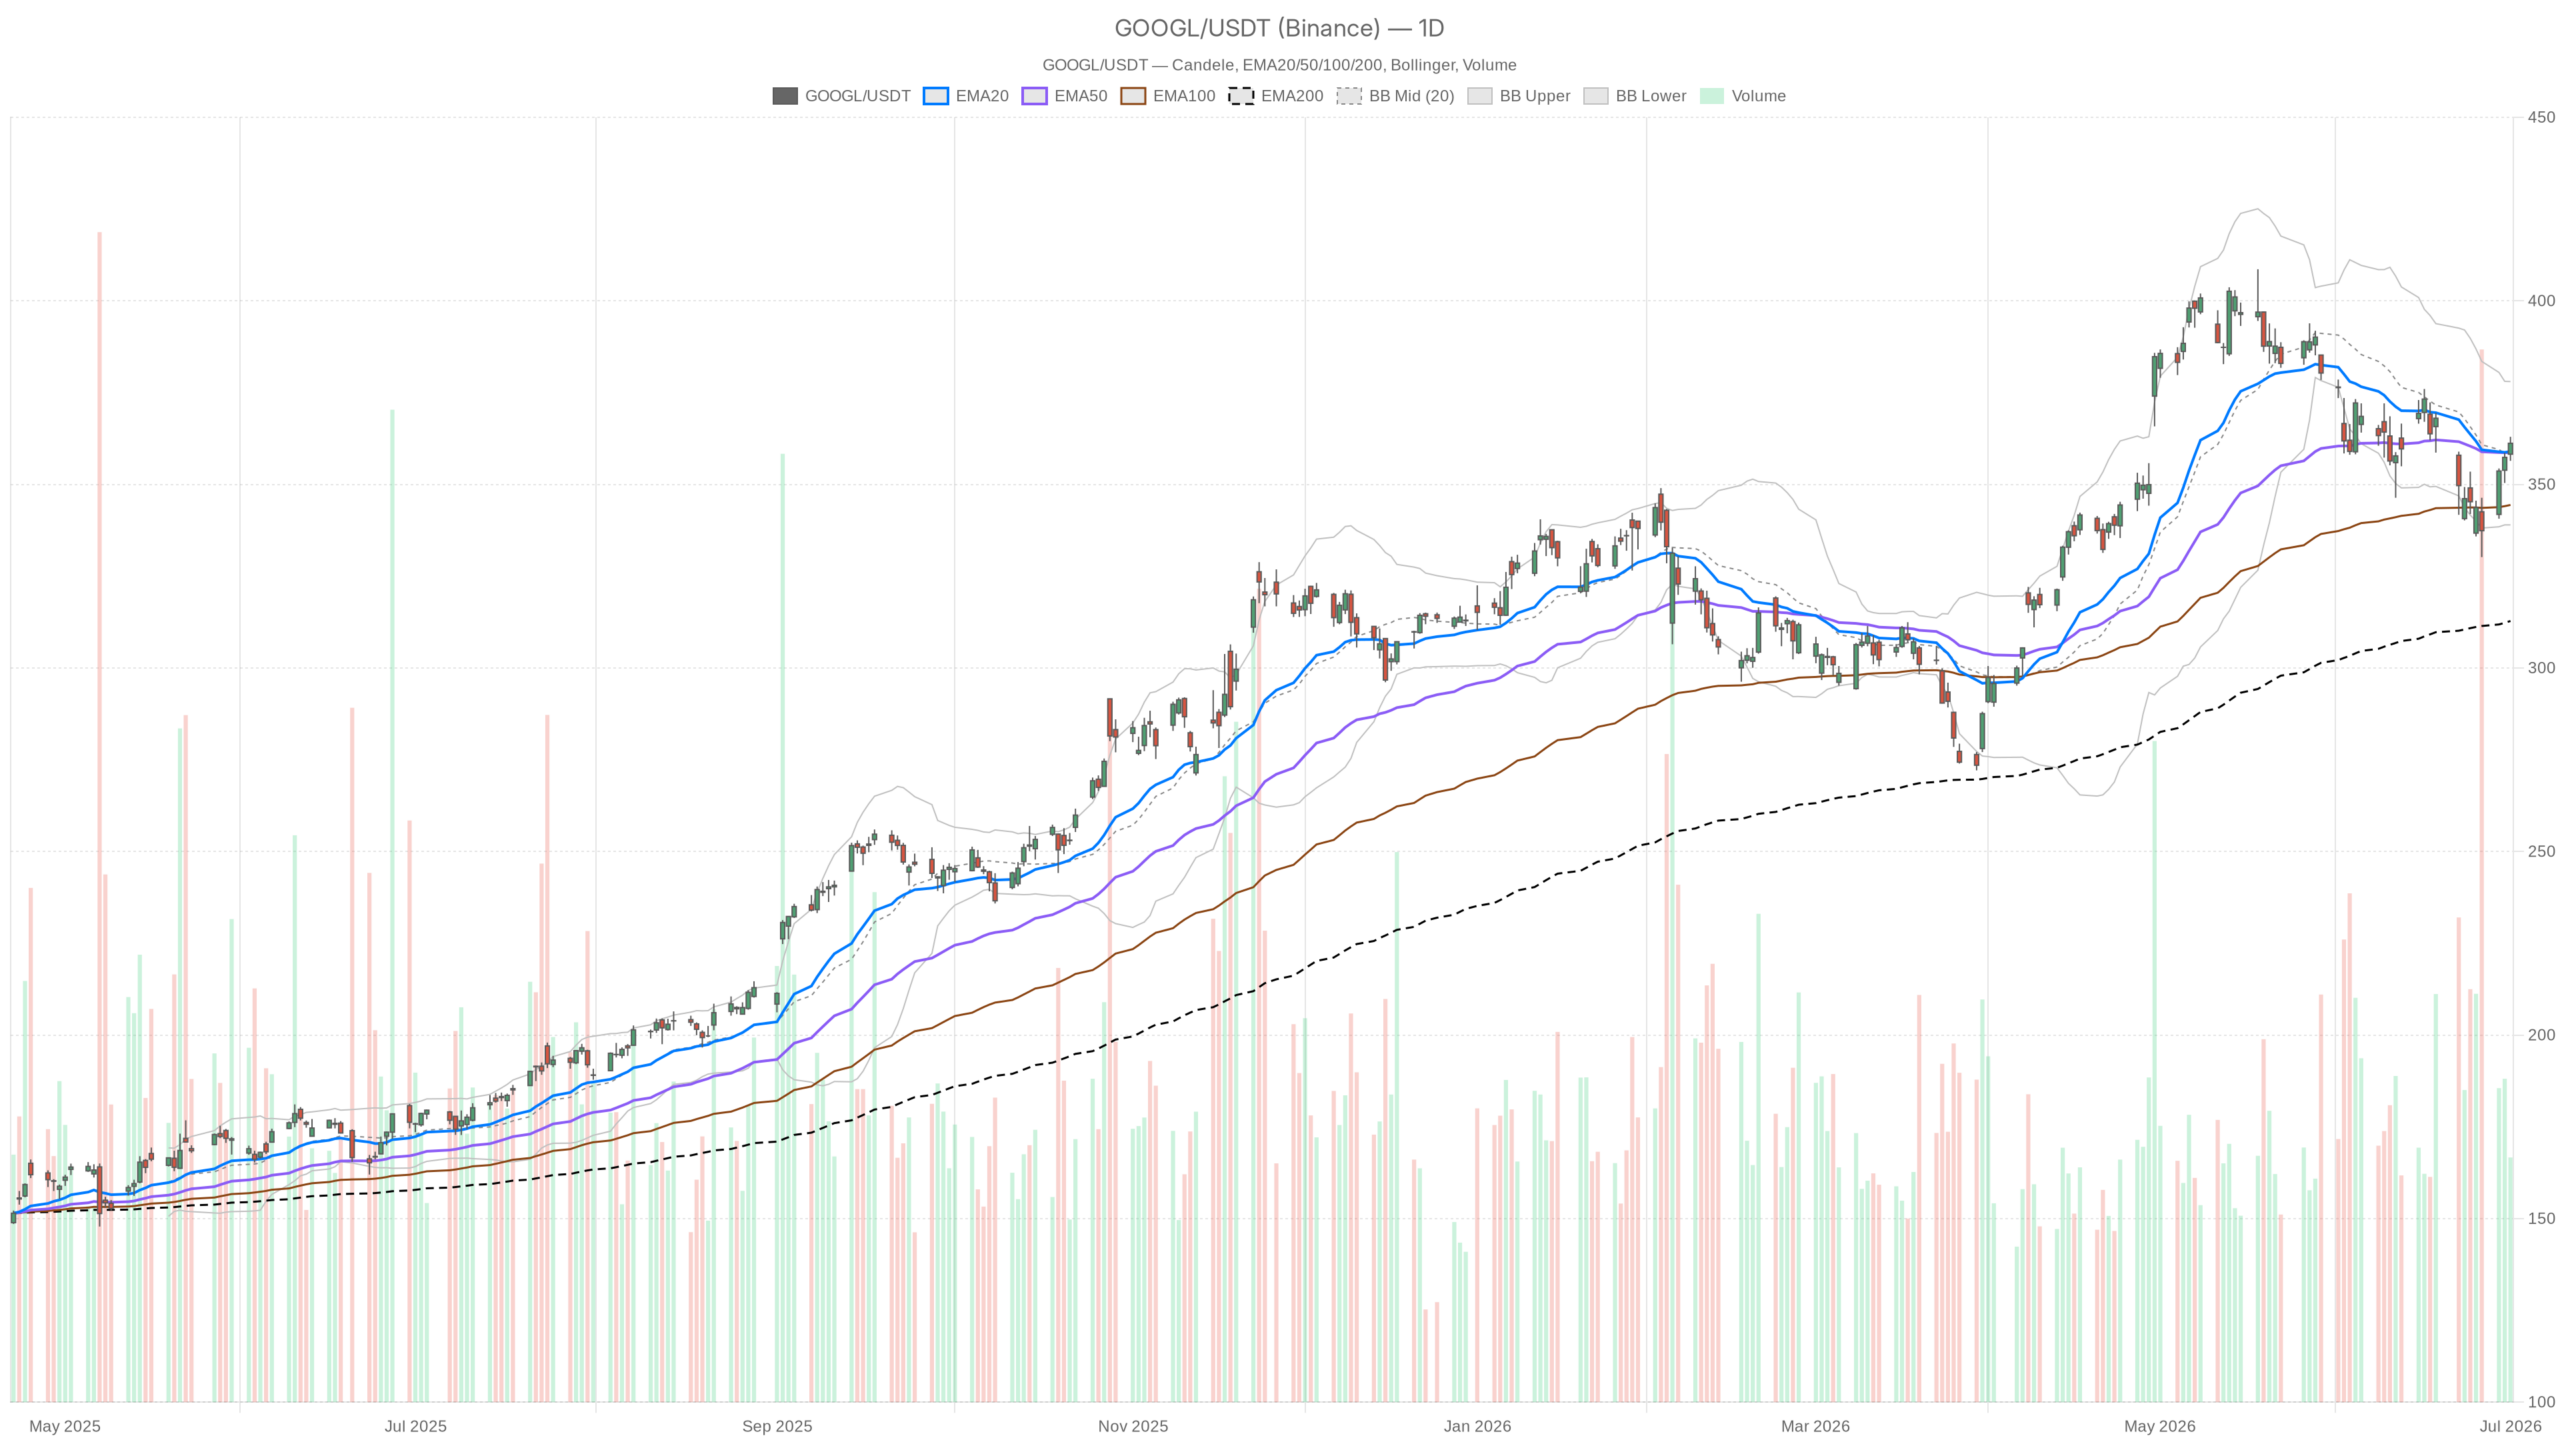 GOOGL — daily chart with candlesticks, EMA20/EMA50 and volume.
Key takeaways
- GOOGL closed at $361.21 on July 1st, holding above the EMA20 ($358.98) and EMA50 ($358.73) on the daily timeframe.
- Alphabet’s inclusion in the Dow Jones Industrial Average introduces structural passive demand and signals an institutional reclassification of the stock.
- The daily MACD remains negative at -5.06, meaning momentum has yet to confirm the bullish price structure.
- Hourly EMA200 resistance at $363.35 must be cleared for short-term bulls to regain full control.
- Daily ATR of $12.38 reflects elevated volatility that demands careful position sizing.
Daily Timeframe: Bullish Bias With Momentum Lagging
The daily chart supports a bullish bias for Alphabet stock, with price firmly above key moving averages. Yet momentum indicators have yet to confirm the rally, and traders should await that confirmation before increasing exposure.
Trend Structure and the Dow Catalyst
GOOGL closed above both the EMA20 at $358.98 and the EMA50 at $358.73. That stacking of short-term averages beneath price signals near-term trend support. More notably, the EMA200 sits at $312.79 — nearly $50 below current price. This gap confirms the longer-term trend is firmly intact. The bull market in GOOGL has not been a recent development.
Meanwhile, Alphabet’s formal inclusion in the Dow Jones Industrial Average adds a structural catalyst. Index inclusion at this level generates non-discretionary demand from passive vehicles tracking the Dow. It also signals an institutional reclassification of GOOGL from a growth-heavy tech play into a core blue-chip holding. For a stock already commanding a market cap above $4 trillion, the symbolic validation matters as much as the mechanical rebalancing.
Momentum Indicators Yet to Confirm
However, the daily MACD complicates the picture. The MACD line sits at -5.06 against a signal of -4.96, with a histogram of -0.10. The line remains negative, meaning macro momentum has not yet fully recovered. The histogram is narrowing, which suggests bearish divergence is compressing. Still, traders should not confuse compression with confirmation. A bullish cross has not occurred yet on this timeframe.
The RSI14 on the daily sits at 50.33 — essentially neutral. GOOGL is neither overbought nor oversold, leaving room to move in either direction without hitting an extreme. In the context of the bullish price structure, this is actually constructive. A rally from here would not immediately run into RSI resistance. Bollinger Bands show a mid-band of $358.50, with the upper band at $378.03 and lower at $338.97. GOOGL trades in the upper half of the range, consistent with the bullish regime.
Hourly Timeframe: Momentum Strengthening, but Resistance Is Close
The hourly chart shows strengthening short-term momentum for Alphabet stock, with a live bullish MACD cross. Still, immediate resistance at the $363.35 EMA200 keeps the overall regime neutral and compresses near-term risk/reward.
Resistance Defines the Short-Term Setup
The hourly RSI14 stands at 65.57, approaching overbought territory. The MACD on the hourly shows a line of 3.26 against a signal of 2.98, with a histogram of 0.28. That is a live bullish cross with positive histogram expansion. Short-term momentum clearly favors the bulls.
In contrast, the hourly EMA200 at $363.35 sits above the current price of $361.22. This is a meaningful overhang. The longer-term trend reference on the hourly chart still points down relative to price. This is why the regime reads neutral rather than bullish. The EMA20 at $356.15 and EMA50 at $353.70 are both well below current price. This confirms the intraday rally has been sharp. But the EMA200 resistance overhead must be respected.
The hourly Bollinger Band upper sits at $362.98. With GOOGL at $361.22, price presses against the top of the 1-hour Bollinger range. This does not mean a reversal is imminent. It does mean the risk/reward for new long entries near these levels is compressed. A clean push above $363 — clearing both the hourly upper Bollinger and the EMA200 — would change the short-term picture materially. Pivot analysis places R1 at $361.86 and support at $360.33. A break above $361.86 with volume would be an immediate bullish signal.
15-Minute Chart: Execution Context Supports Upside Bias
The 15-minute chart offers an execution-level bullish bias for GOOGL, with all three EMAs stacked favorably and price above them. That said, the stock is once again pressing into short-term band resistance, which argues against chasing entries at current levels.
All three EMAs are stacked bullishly — EMA20 at $359.66, EMA50 at $357.60, and EMA200 at $353.96 — with price above all three. The RSI14 at 62.34 and a positive MACD histogram of 0.05 suggest modest but intact intraday momentum. The ATR on this timeframe is just $1.09, meaning micro-moves are contained.
Notably, the 15-minute upper Bollinger sits at $361.77, right where price is trading. A brief consolidation or shallow pullback toward $360.33 would offer a more favorable risk-defined entry for those aligned with the bullish daily view.
Bullish Scenario for Alphabet Stock
The bull case for Alphabet stock rests on a structurally supportive foundation. GOOGL holds above its key daily moving averages. The daily regime reads bullish. The Dow inclusion introduces a new and durable buyer base. If price clears the $362–$363 zone, it would resolve both the hourly EMA200 resistance and the upper Bollinger. The next meaningful level is R1 on the daily at $363.98. Beyond that, the upper daily Bollinger at $378.03 represents the broader bullish target range.
Fundamentally, the AI-driven growth narrative supports the case. The $4 trillion market cap milestone reinforces that institutional interest in GOOGL remains firm. A daily MACD crossover into positive territory would add meaningful technical confirmation. It would shift momentum fully in favor of the bulls.
Bearish Scenario for Alphabet Stock
The bearish case for GOOGL centers on momentum divergence and nearby technical resistance. The daily MACD remains in negative territory, and the line has not crossed above the signal on the longer timeframe. A failure to follow through above $363 could cause intraday momentum to stall and reverse.
Additionally, the hourly EMA200 at $363.35 is a live technical barrier. Some market commentary points to stretched valuations and limited near-term upside. At least one analyst has framed GOOGL as a hold rather than a buy at current levels. If price breaks back below the $357–$358 zone — through the daily EMA20 and EMA50 — the bullish daily regime would come under serious pressure. A deeper move toward the daily S1 at $357.44 would be the first concrete warning sign.
Positioning and Volatility Outlook
GOOGL enters early July in a constructive but not frictionless position. The daily bias is bullish, the Dow inclusion catalyst is structurally supportive, and short-term momentum is rising. Yet the daily MACD lag and the hourly EMA200 overhang mean this is not a low-resistance breakout environment.
Volatility, as measured by a daily ATR of $12.38, remains elevated enough to punish poorly timed entries. The most defensible posture is patience. Wait for the $363 resistance to either break with conviction or reject clearly before committing aggressively in either direction. The trend favors the bulls, but the next few sessions will determine whether this consolidation resolves higher or requires a deeper reset first.
FAQ
What does Alphabet’s Dow inclusion mean for GOOGL stock?
Alphabet’s inclusion in the Dow Jones Industrial Average generates structural, non-discretionary demand from passive funds that track the index. It also signals an institutional reclassification of GOOGL from a growth-heavy tech stock into a core blue-chip holding. For a company already commanding a market cap above $4 trillion, the symbolic validation reinforces long-term institutional confidence in the stock.
Is GOOGL stock a buy based on current technicals?
The daily chart supports a bullish bias, with GOOGL trading above its EMA20, EMA50, and EMA200. However, the daily MACD remains negative, and the hourly EMA200 at $363.35 presents immediate resistance. A confirmed break above $363 would strengthen the bull case considerably. Until then, the risk/reward for new long entries near current levels is compressed, and patience is warranted.
What is the key resistance level GOOGL must clear?
The critical near-term resistance zone sits between $362 and $363.35. This range encompasses the hourly upper Bollinger Band at $362.98 and the hourly EMA200 at $363.35. A clean break above this zone with volume would open the path toward R1 at $363.98 and eventually the daily upper Bollinger Band at $378.03.
What would invalidate the bullish case for Alphabet stock?
A break below the $357–$358 zone — which contains the daily EMA20 at $358.98 and EMA50 at $358.73 — would put the bullish daily regime under serious pressure. A move toward the daily S1 at $357.44 would serve as the first concrete warning sign that the consolidation is resolving to the downside rather than higher.
Disclaimer: This article is for informational purposes only and does not constitute financial advice, an investment recommendation, or a solicitation to buy or sell any financial instrument or cryptocurrency. The analysis provided is not indicative of future results. Investing in crypto assets and financial markets carries a high risk of capital loss. Always do your own research (DYOR) and consult a qualified financial advisor before making any decision.
Article produced with the assistance of artificial intelligence and reviewed by the editorial team.


You May Also Like

Ethereum is splitting into three power centers and ETH treasury firms are paying for two

Mizuho’s $130 Robinhood Price Target Says Crypto Is Underpriced


