

AUD/USD Price Forecast: Losses Hold Below 0.7150 as Descending Wedge Pattern Emerges
BitcoinWorld
AUD/USD Price Forecast: Losses Hold Below 0.7150 as Descending Wedge Pattern Emerges
The Australian dollar continues to trade under pressure against the US dollar, with the AUD/USD pair holding losses below the 0.7150 level. Technical analysts are now observing the formation of a descending wedge pattern on the daily chart, a structure that often signals a potential reversal or continuation depending on the breakout direction.
Technical Breakdown: The Descending Wedge
A descending wedge is characterized by converging trendlines that slope downward, with price action making lower highs and lower lows within a narrowing range. In the case of AUD/USD, the pair has been tracing this pattern since early March, with resistance near 0.7160 and support gradually declining toward 0.7100.
Traders watch for a breakout above the upper trendline as a bullish signal, while a breakdown below the lower trendline could accelerate losses. Volume patterns and momentum indicators, such as the Relative Strength Index (RSI), are currently neutral, offering no clear directional bias.
Fundamental Drivers Weighing on the Aussie
The Australian dollar’s weakness reflects multiple headwinds. The Reserve Bank of Australia (RBA) has maintained a cautious stance, keeping interest rates steady while inflation remains above target but shows signs of cooling. Meanwhile, the US dollar has found support from resilient US economic data and hawkish commentary from Federal Reserve officials, which has reinforced the interest rate differential favoring the greenback.
Commodity prices, particularly iron ore and coal, have also softened in recent weeks, reducing export revenue expectations for Australia. This adds to the bearish sentiment surrounding the currency.
Key Levels to Watch
Immediate resistance for AUD/USD stands at 0.7150, followed by the wedge’s upper boundary near 0.7180. A decisive close above 0.7200 would negate the bearish wedge structure and open the door for a rally toward 0.7250.
On the downside, support is at 0.7100, with the wedge’s lower trendline around 0.7080. A break below 0.7050 would signal a bearish breakdown, potentially targeting the 0.7000 psychological level.
Conclusion
The AUD/USD pair remains in a technical consolidation phase, with the descending wedge pattern keeping traders alert for a breakout. The outcome will likely depend on upcoming economic data from both Australia and the United States, including employment figures and inflation reports. Until a clear breakout occurs, the pair is expected to trade within the wedge’s boundaries, with a bearish bias prevailing below 0.7150.
FAQs
Q1: What does a descending wedge pattern mean for AUD/USD?
A descending wedge is a technical chart pattern that can indicate either a bullish reversal or a continuation of the downtrend. The direction of the breakout determines the signal. A move above the upper trendline is bullish, while a breakdown below the lower trendline is bearish.
Q2: Why is AUD/USD falling below 0.7150?
The pair is under pressure due to a combination of a cautious RBA, a strong US dollar supported by hawkish Fed policy, and softer commodity prices. These factors have reduced demand for the Australian dollar.
Q3: What key levels should traders monitor?
Traders should watch the 0.7150 resistance and 0.7100 support levels. A breakout above 0.7200 or below 0.7050 would confirm the next directional move. The wedge’s boundaries near 0.7180 and 0.7080 are also important.
This post AUD/USD Price Forecast: Losses Hold Below 0.7150 as Descending Wedge Pattern Emerges first appeared on BitcoinWorld.


You May Also Like
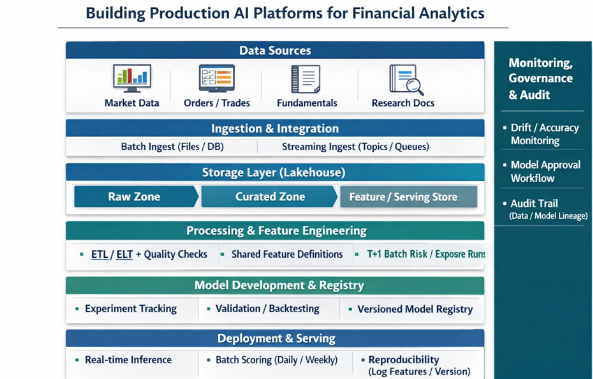
Building Production AI Platforms for Financial Analytics

The Role of Reference Points in Achieving Equilibrium Efficiency in Fair and Socially Just Economies

Over 50,000 South Koreans Sign Petition to Block 2027 Crypto Tax


