

Analyst Maps XRP’s Path To 31% Of The Entire Crypto Market
Crypto analyst Will Taylor, known as Cryptoinsightuk on X, said XRP’s market-cap dominance still shows a bullish structure despite its recent pullback from a key range high. His latest chart of XRP.D maps a potential long-term move toward 31.26% dominance, far above the current area near 3.315%.
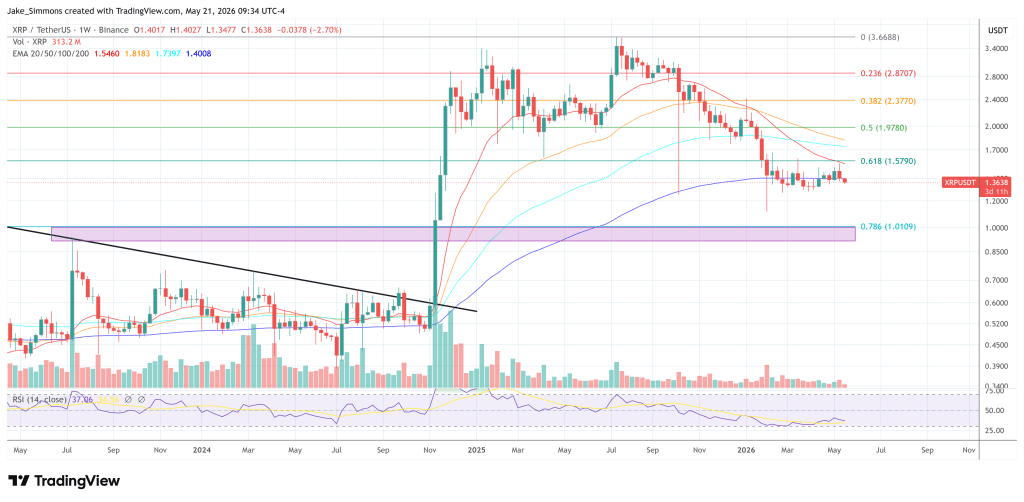
Taylor’s argument centers on market structure rather than short-term sentiment. In the chart, XRP dominance is shown holding above a major horizontal level around 3.315%, after breaking out from a multi-year range and failing to fully clear the 6.127% area. The weekly setup then compresses into a descending wedge, with the analyst suggesting that the retracement has not yet invalidated the broader breakout.
“As I look at $XRP.D, I still struggle to feel bearish here,” Taylor wrote. “What I think we’re seeing is: a completed Wyckoff accumulation, a breakout above the major 3.315% resistance, a failed attempt to fully break through the 6.127% range high, then a pullback into a compressed descending wedge.”

The Path To 31% Market Dominance For XRP
The chart presents 6.127% as the next major range high, while 31.26% is marked much higher on the dominance scale as a possible upside objective. That framing implies an aggressive expansion in XRP’s share of the total crypto market if the analyst’s continuation thesis plays out. It does not require XRP alone to rise in isolation; dominance can also increase if XRP outperforms other major crypto assets during a broader rotation.
Taylor’s focus is on the behavior after the failed push through 6.127%. Rather than seeing the rejection as evidence of distribution, he described the current structure as compression. In his view, a decisive bearish breakdown would likely look different, with stronger downside momentum and heavier sell pressure.
“To me, that matters,” he said. “Because descending wedges are often reversal / continuation structures, especially when they’re paired with diminishing volume. If sellers were truly in control, I’d expect to see expanding downside volatility and aggressive sell volume, not compression.”
The chart also includes RSI, which has been trending lower alongside price compression. Taylor argued that this does not yet represent a full structural breakdown. Instead, he said the indicator appears to be compressing in its own downtrend while XRP dominance holds above the breakout zone.
That distinction is central to his thesis. A market that breaks out, rejects at a higher resistance, then consolidates above former resistance can still be read as constructive, provided the former breakout level is defended. In this case, the 3.315% zone is the key reference point. A sustained loss of that area would weaken the continuation argument, while a breakout from the wedge could bring the 6.127% range high back into focus.
The Wyckoff Thesis
The Wyckoff labels on Taylor’s chart are central to the bullish reading. The structure marks a long accumulation sequence beginning with preliminary support, or PS, followed by a selling climax and secondary test around the 2020–2021 lows. The subsequent automatic rally, secondary test and “spring” are presented as the base-building phase before XRP dominance reclaimed higher ground.
From there, the chart identifies a move over the “creek”, a Wyckoff term often used to describe the transition out of an accumulation range, followed by a sign of strength near the 6.127% range high. The latest pullback is labeled as an LPS, or last point of support, which in Wyckoff analysis is typically watched as a potential higher-low area before continuation.
That makes the 31.26% marker more than a loose upside arrow in Taylor’s framing. The chart is effectively arguing that XRP dominance has moved from accumulation into markup, with the current descending wedge serving as a possible consolidation above the breakout zone rather than evidence of failed demand. The bullish case depends on that LPS interpretation holding; if the structure breaks back below the reclaimed 3.315% level, the Wyckoff continuation thesis would become harder to defend.
Taylor also framed the setup as one that may need a catalyst. “It honestly feels like XRP dominance is waiting for a catalyst before attempting another move higher,” he wrote. “I know this goes against a lot of current sentiment and market interpretation, but I’d genuinely love to hear the bearish argument from here structurally, because right now I still see more signs pointing toward bullish continuation than full distribution.”
The 31.26% marker gives the chart its most striking implication, but the nearer technical question is whether XRP dominance can continue to hold the reclaimed 3.315% level and resolve the wedge to the upside. For now, Taylor’s read is clear: the structure has pulled back, but in his view, it has not yet broken.
At press time, XRP traded at $1.36.


You May Also Like

BREAKING NEWS: Tragic Loss – Fatu, One of the World’s Last Northern White Rhinos, Shot and Killed at Ol Pejeta Conservancy
Australian Dollar Dips Below 0.7150 as Weak Jobs Data Dampens RBA Rate Hike Hopes

Trump postpones AI executive order, cites need to compete with China


