Bitcoin traders brace for $1 billion liquidation trap after inflation shock breaks $80,000
Bitcoin’s break below $80,000 has pushed traders toward a crowded leverage zone where a further decline could force about $1 billion of long positions out of the market.
According to CryptoSlate data, the largest cryptocurrency fell to as low as $78,725 after US inflation readings came in hotter than expected, weakening expectations that the Federal Reserve will be able to cut interest rates later this year.
As of press time, Bitcoin has recovered to $79,500, down about 2% on the day and roughly 37% below its October record above $126,000.
This price performance has left Bitcoin wedged between two closely watched liquidation levels. CoinGlass data from May 14 shows an estimated $1 billion of long positions on major exchanges could be liquidated if Bitcoin falls below $78,000. A rebound to about $80,458 would put roughly $640 million of short positions at risk.
That narrow range has become the market’s immediate battleground after inflation data interrupted Bitcoin’s recovery from April lows.
Notably, the current sell-off also coincides with softer US demand signals, outflows from spot Bitcoin exchange-traded funds, and renewed profit-taking by investors whose holdings returned to gains during the rally.
 Bitcoin caught between bullish and bearish traders arguing over liquidations
Leverage builds around $78,000
In a note shared with CryptoSlate, CryptoQuant noted that BTC's rally above $80,000 was driven by speculative demand.
As a result, the $78,000 level now carries more weight because leveraged long positions are concentrated below it.
This level of concentration indicates where forced selling or buying could intensify if the price reaches that threshold. A large cluster means the market could move faster once that zone is hit, as exchanges close positions that no longer meet margin requirements.
Coinglass's liquidation map shows the greater immediate downside risk. If Bitcoin slides below $78,000, forced closures of long positions could add sell pressure at the same time spot demand is already weakening.
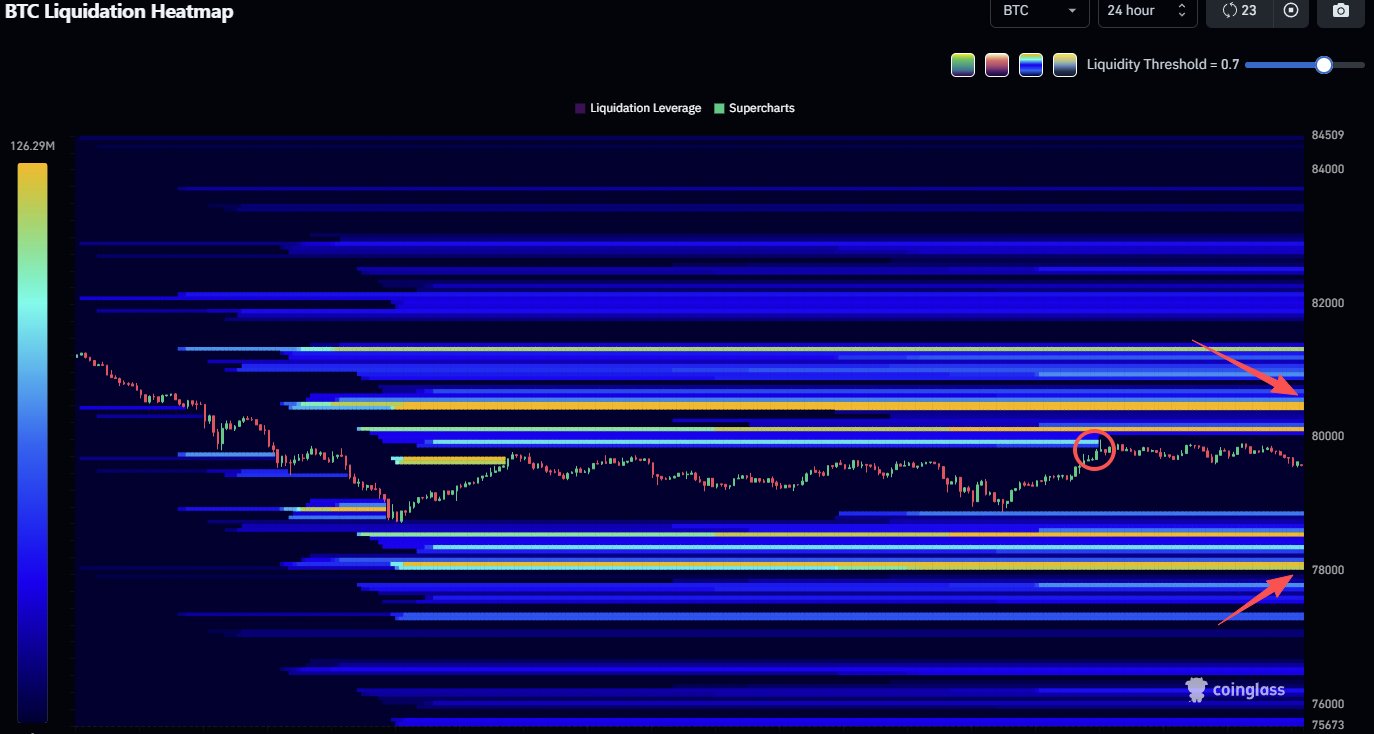 Bitcoin Liquidation Levels (Source: CoinGlass)
That could turn an ordinary pullback into a sharper deleveraging move.
Meanwhile, the upside risk is smaller but still relevant. A move back to $80,458 would pressure roughly $640 million of short positions, creating the possibility of forced buying if bears are caught leaning too heavily into the inflation-driven drop.
That tension leaves Bitcoin in a compressed range. A break lower would test whether April’s recovery had enough spot demand behind it. A recovery above $80,000 would show that the inflation shock has not fully reversed the rebound.
Spot Bitcoin demand softens as ETF outflows spike
Meanwhile, Bitcoin's derivatives setup is becoming more fragile because recent spot-market signals have softened.
According to CryptoQuant data, the Coinbase Bitcoin Premium Index has been declining since late April. The index tracks the price gap between Coinbase and Binance and is often used as a gauge of US demand.
A sustained negative reading suggests buying pressure from US-linked investors has cooled as Bitcoin approached $80,000.
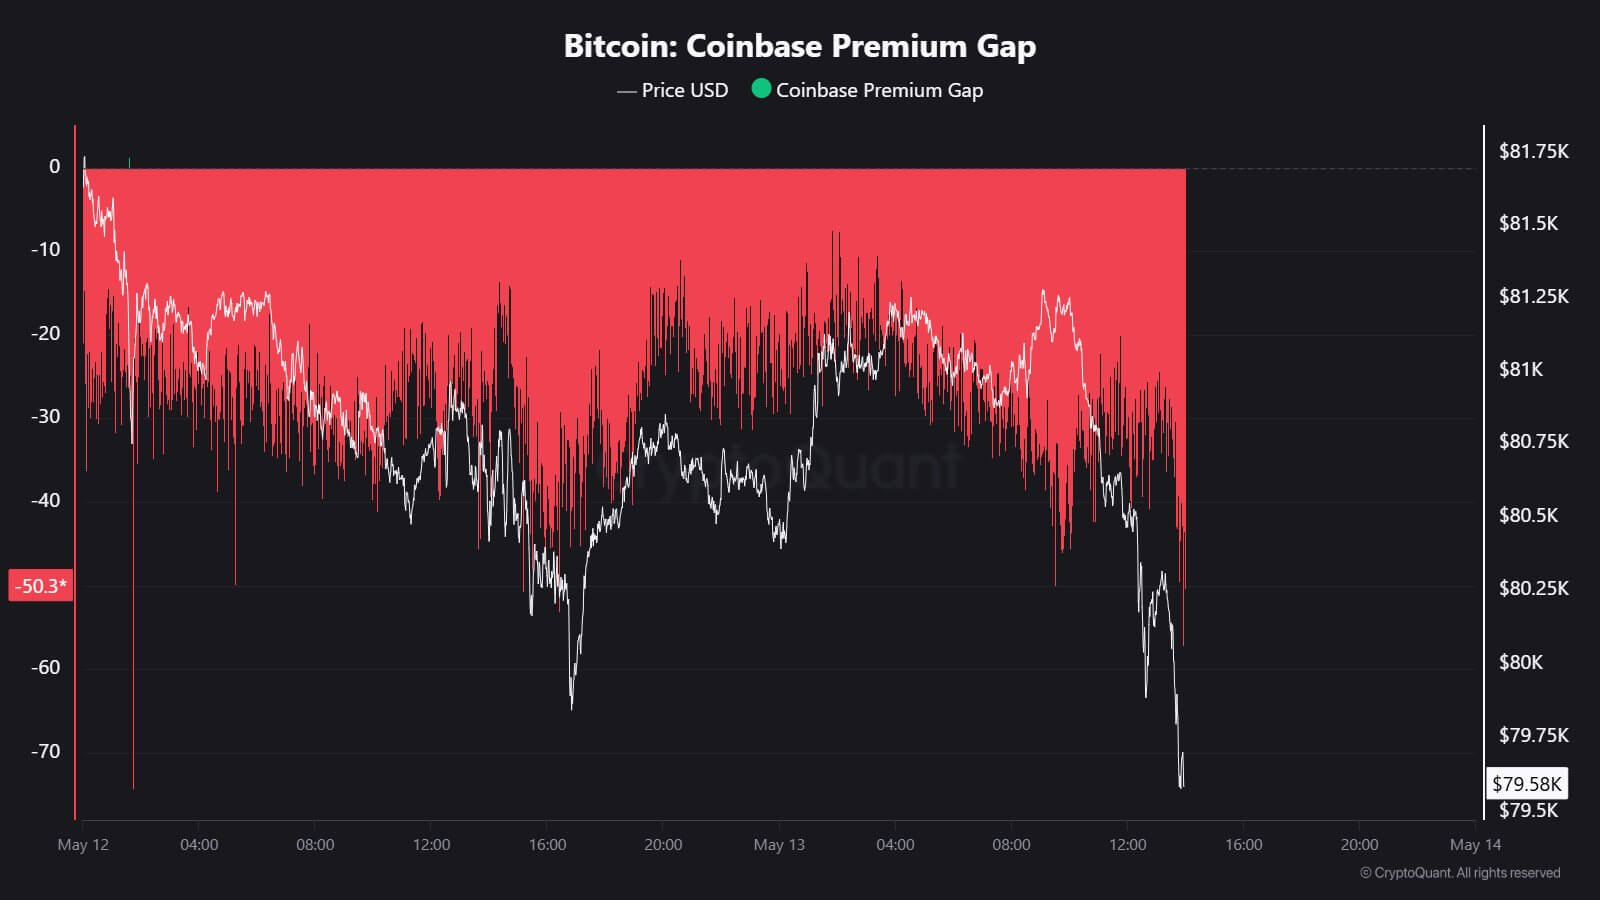 Bitcoin Coinbase Premium (Source: CryptoQuant)
In this case, CryptoQuant analyst JA Maarturn explained that the signal means that “US Institutional (large players) [are] selling bitcoin.”
This is corroborated by ETF flows, which have also turned less supportive this week with more than $800 million in outflows.
Data from SoSoValue shows that the poor performance was mainly driven by the $630.38 million in net outflows on May 13. This was the second consecutive day of withdrawals and the largest single-day outflow in three months.
Additional Glassnode data also shows that the seven-day moving average of US spot ETF net flows fell to -$88 million a day, the deepest outflow since mid-February.
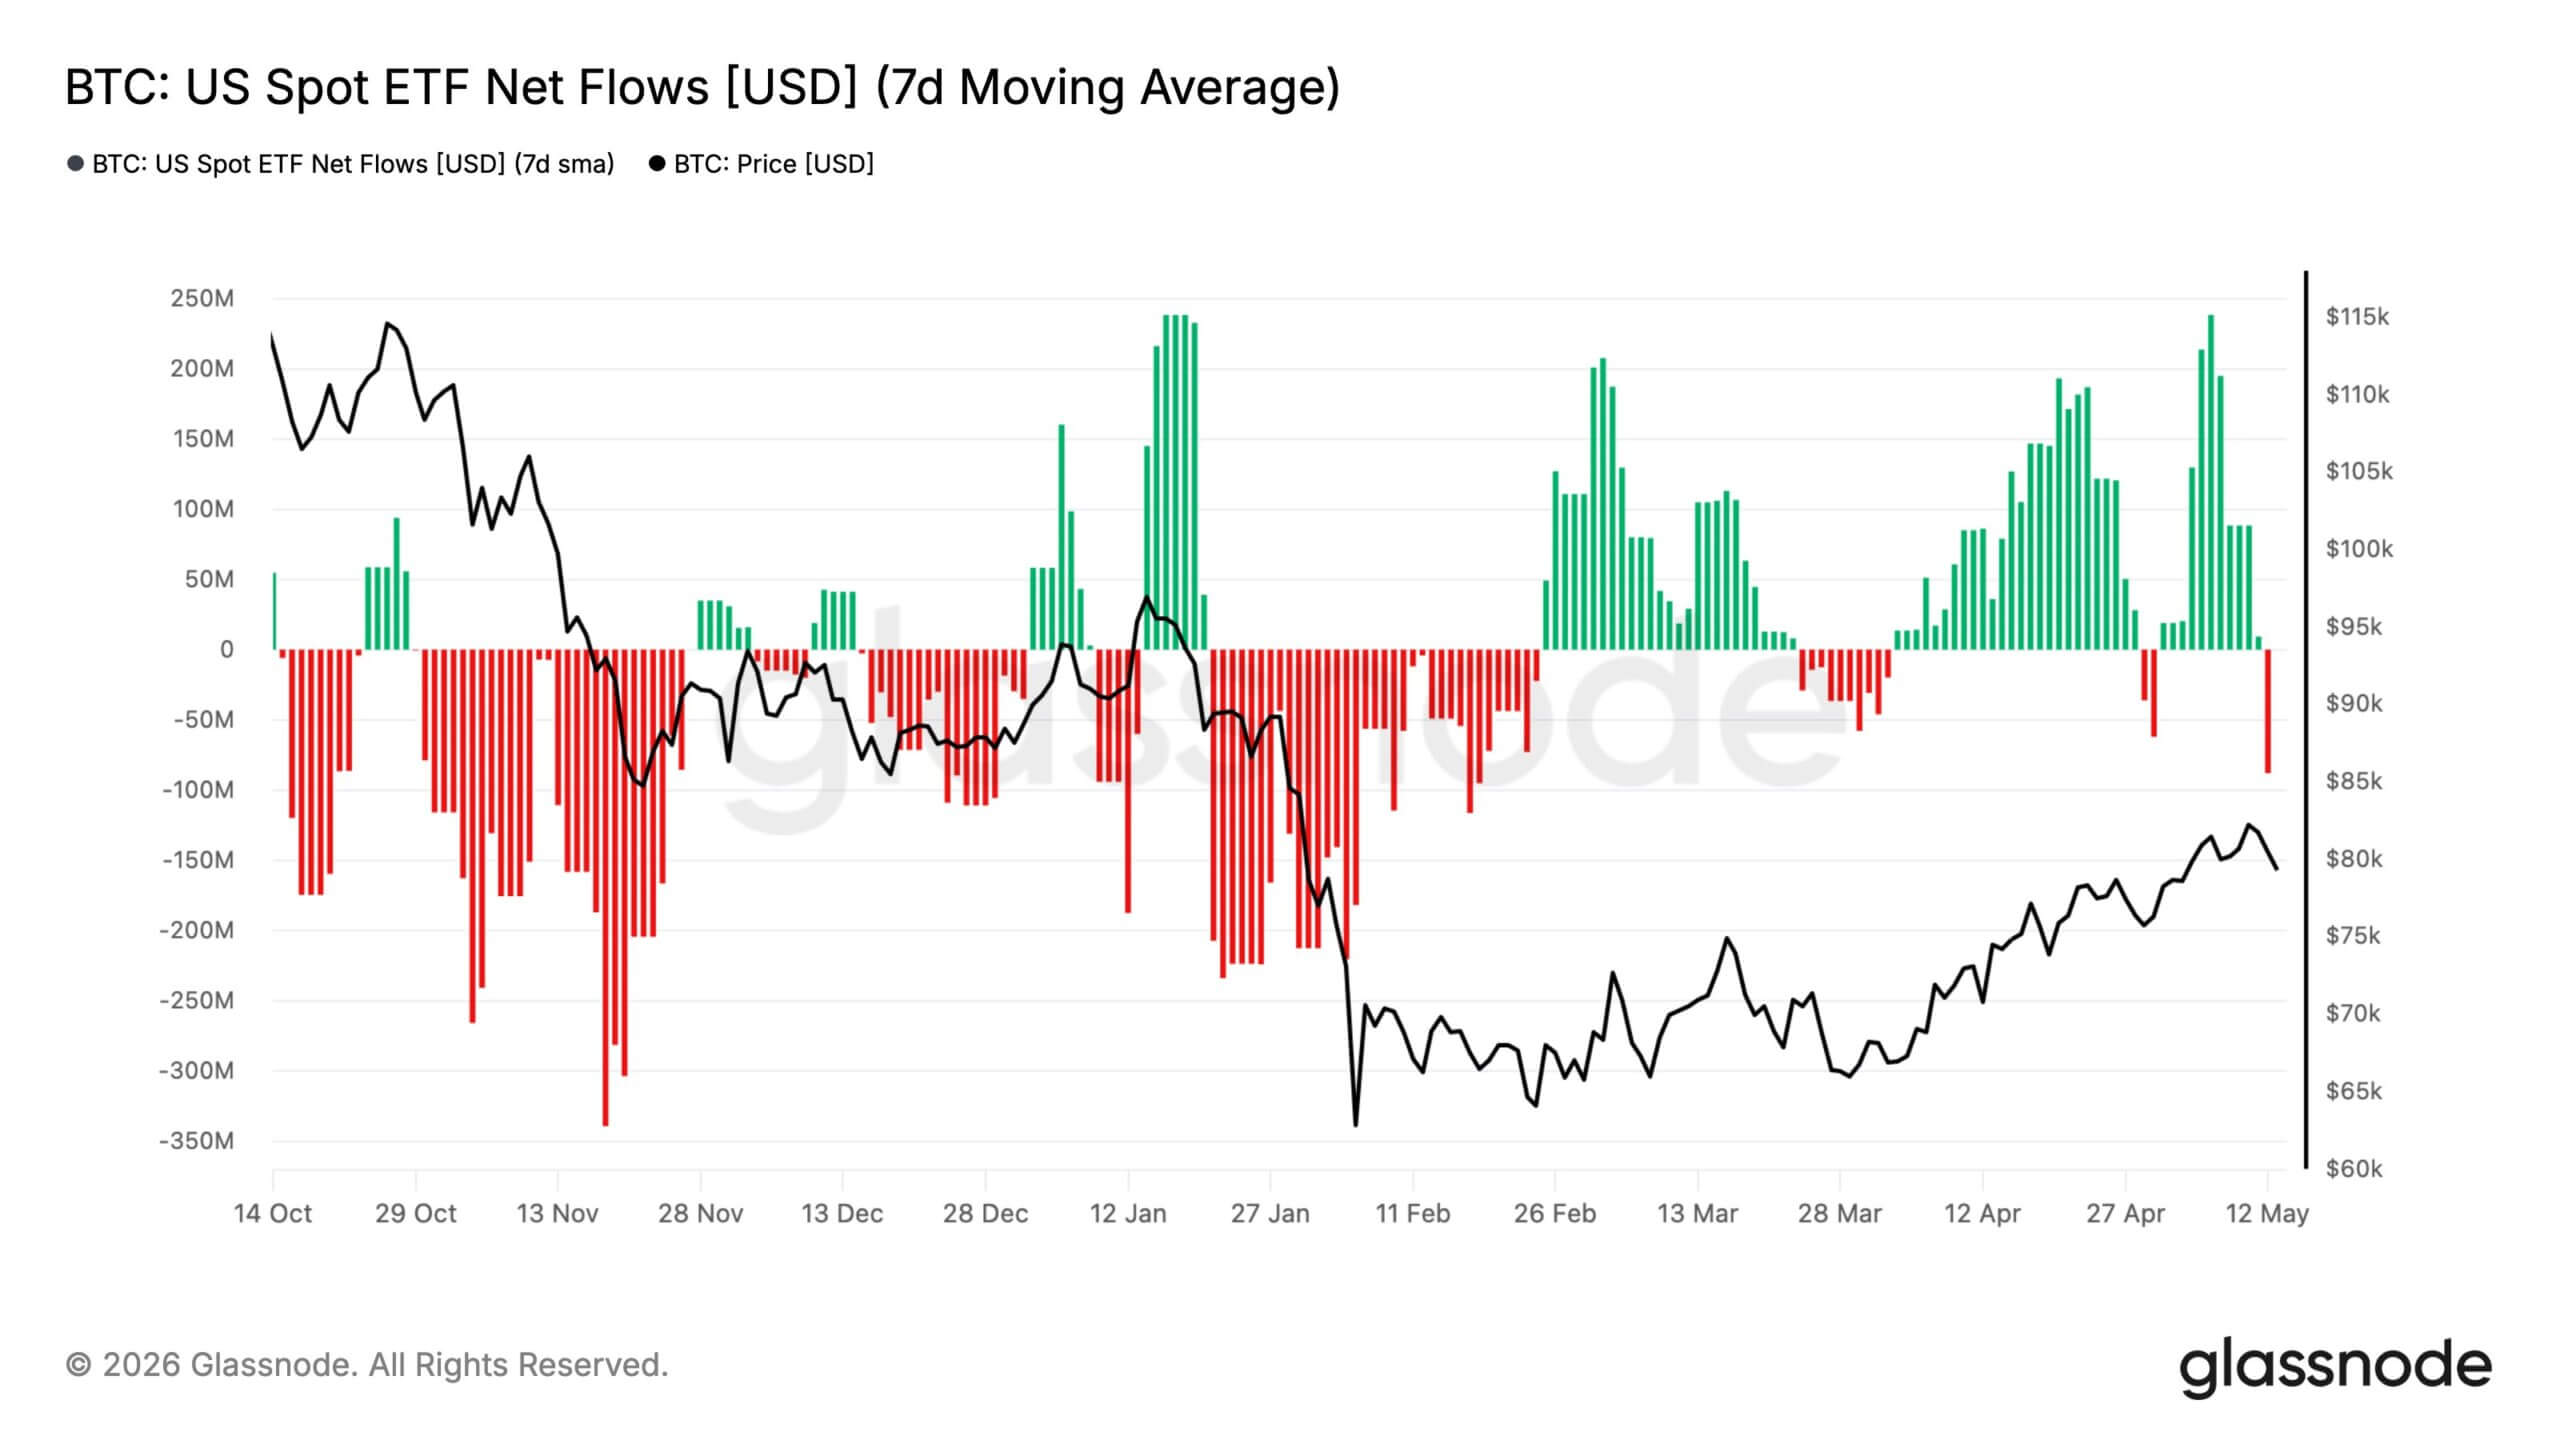 Bitcoin ETF Net Flows (Source: Glassnode)
Market analysts noted that these flows indicated that some institutional investors used BTC's $80,000 recovery to reduce exposure rather than increase risk.
However, the picture is not one-way as the spot Bitcoin ETFs still had more than $400 million in net inflows month-to-date, a sign that investor appetite has not disappeared.
The recent reversal, however, shows that demand has become more selective as the rally runs into macro pressure and technical resistance.
The 200-day average becomes the upside test
Against this backdrop, Bitcoin’s immediate downside test is $78,000, the early-May low that preceded the rally toward $82,000. A break below that level would put the liquidation cluster in play and raise the risk of a move toward the late-April capitulation zone.
Still, BTC's primary resistance level sits near $82,400, its 200-day moving average. CryptoQuant data show Bitcoin reached that level after a 37% rally from April lows.
The setup resembles that of March 2022 in one respect: Bitcoin then rallied about 43% before meeting its 200-day moving average and later resumed its decline.
According to the firm, a clean break above $82,400 would ease pressure on bulls and could force short sellers to rethink positions.
However, failure near that zone would reinforce the view that Bitcoin’s rebound has run into resistance just as profit-taking and ETF outflows are picking up.
If Bitcoin falls below $78,000, the next major on-chain support sits closer to $70,000, near traders’ on-chain realized price.
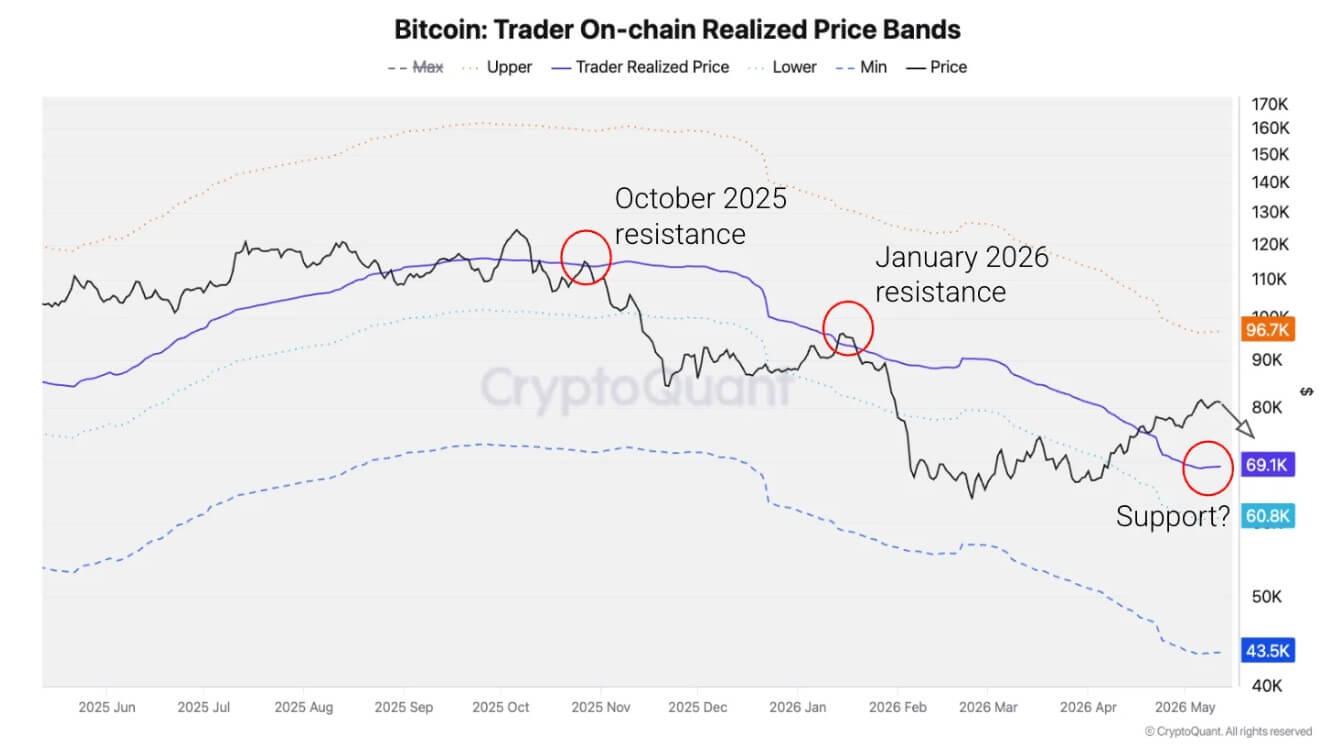 Bitcoin On-Chain Price Support (Source: CryptoQuant)
That level represents the average cost basis of short-term traders and has historically acted as a support band when unrealized profits compress back toward zero.
The post Bitcoin traders brace for $1 billion liquidation trap after inflation shock breaks $80,000 appeared first on CryptoSlate.


You May Also Like

Ex-ICI spox Hosaka returns to GCG

Pundit Says This XRP and CLARITY Act Video Will Give You Goosebumps.