

Solana (SOL) Flashes Rare Buy Signal After 9-Month Drought — Could $100 Be Next?
Key Highlights
- Solana’s 3-day SuperTrend indicator has triggered its first buy signal since October 2025, indicating a possible momentum shift
- Network expansion continues with 1.6 million fresh addresses created over the last fortnight, according to analyst Ali Charts
- Top Binance traders maintain a Long/Short Ratio of 1.89, with long positions comprising 65.45% of total exposure
- The critical $84 resistance barrier stands between current levels and the next targets at $90 and potentially $100
- Weekly chart displays bullish RSI divergence, hinting that the extended correction period could be concluding
Solana appears to be displaying preliminary indicators of a momentum reversal following a significant technical signal turning positive for the first time in nearly a year. This development follows an extended pullback that brought SOL down to approximately $60 during June.
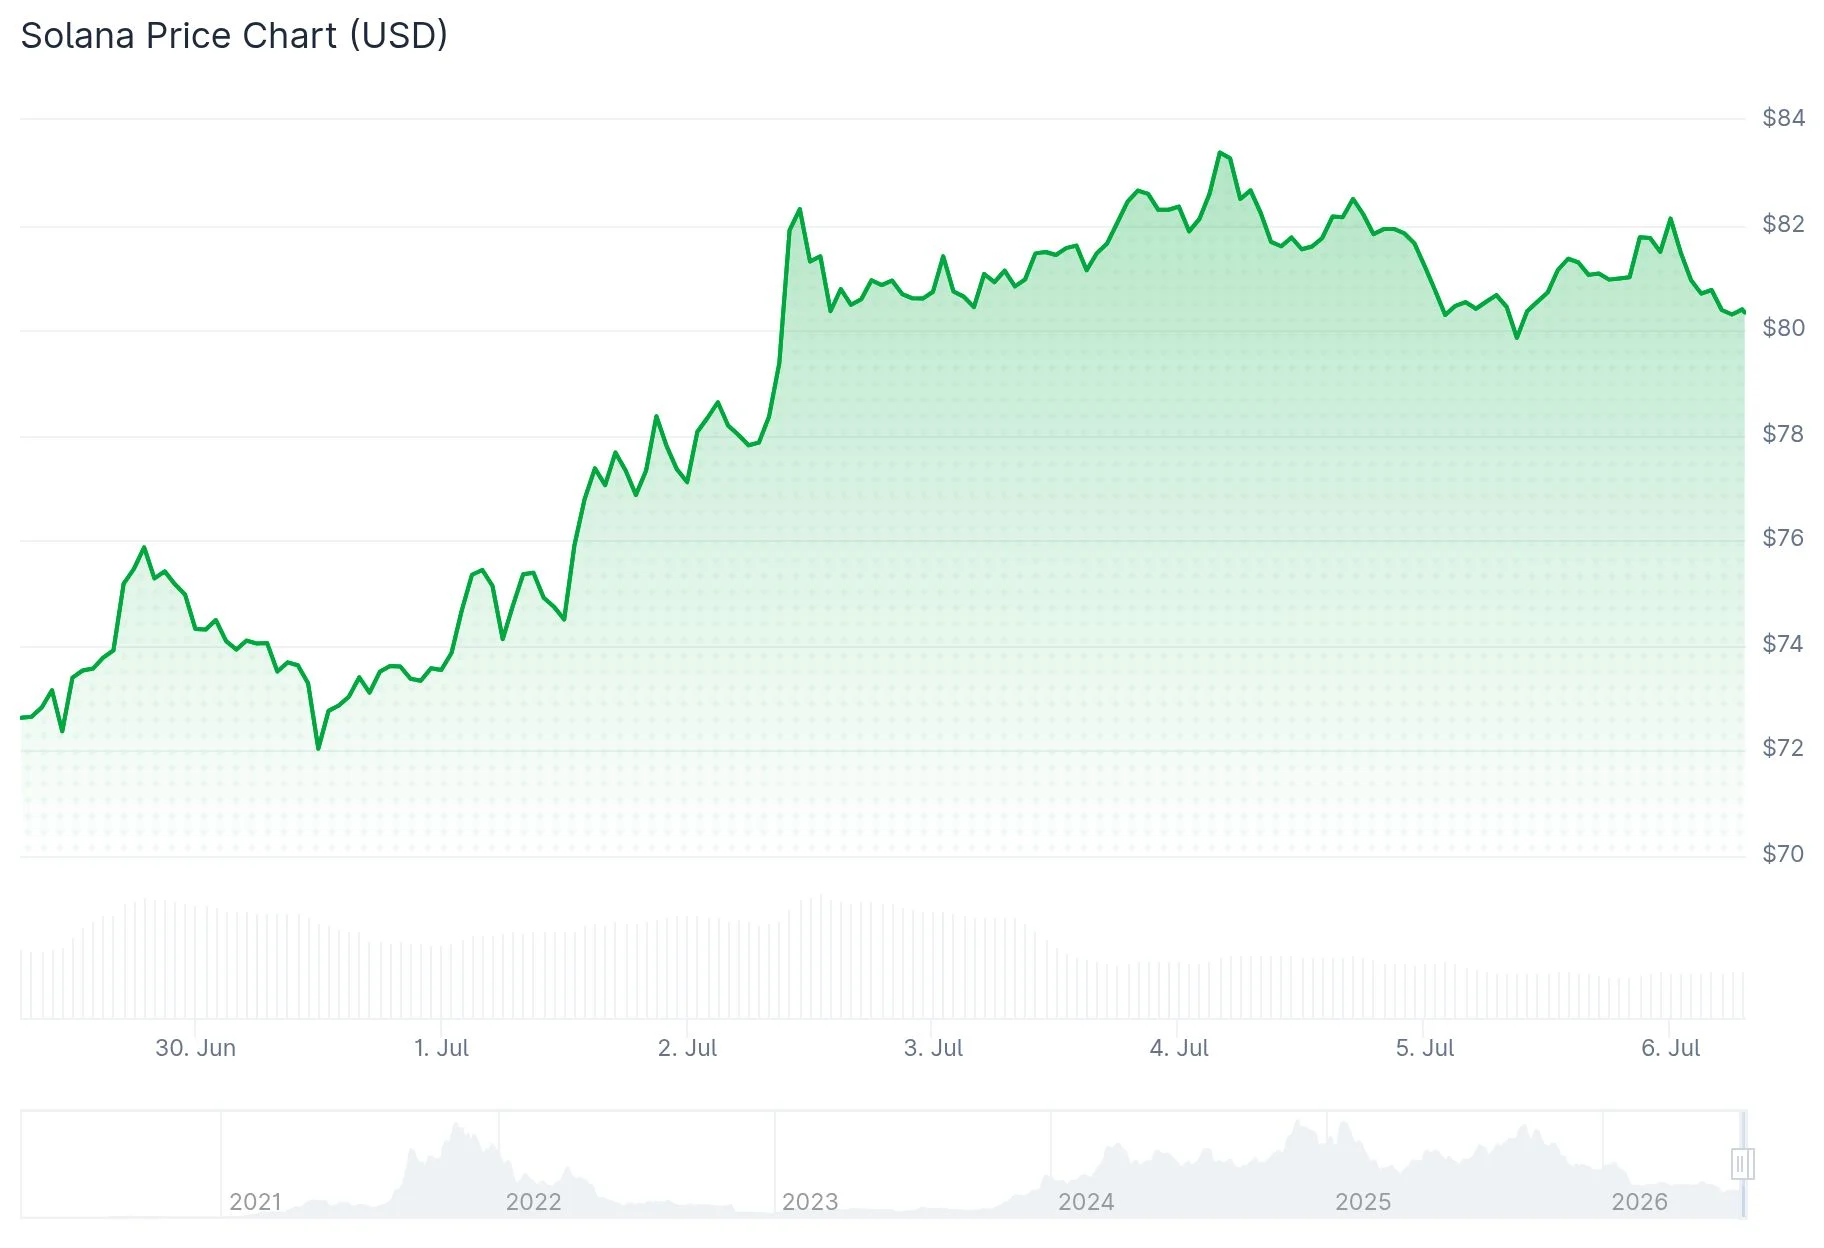 Solana (SOL) Price
The SuperTrend indicator on the three-day timeframe has produced a buy signal — marking the first occurrence since October 2025. The prior sell signal was followed by a substantial 74% decline, making this fresh signal particularly noteworthy for market participants.
Crypto analyst Ali Charts highlighted the development on X, emphasizing the SuperTrend flip beneath the current price level as confirmation that accumulation momentum could be strengthening. This indicator leverages average true range calculations to identify trend shifts, and when it positions below price action, market technicians typically interpret this as a bullish development.
Ali Charts provided additional insight through another metric: the Solana blockchain has welcomed 1.6 million fresh addresses during the previous fourteen days. Such network expansion typically indicates increasing user engagement and heightened interest across the ecosystem.
Institutional Trader Sentiment
Binance’s most sophisticated traders are displaying strong bullish conviction. CoinGlass data reveals that long accounts represent 65.45% of monitored positions, while short accounts comprise 34.55%. This distribution produces a Long/Short Ratio of 1.89.
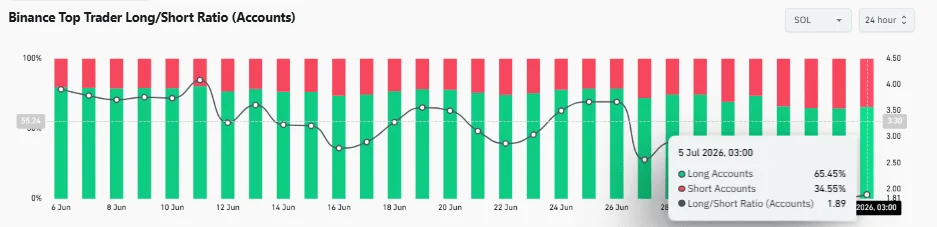 Source: Binance
Despite SOL’s rebound from June’s bottom, professional market participants have maintained their long exposure without significant reduction. This positioning implies that institutional actors continue anticipating additional upward movement.
The OI-Weighted Funding Rate registers at a slightly positive 0.0027%, indicating that leveraged long position holders are compensating shorts. Funding rates have remained in positive territory throughout the recent price recovery while avoiding extreme levels that would suggest excessive speculation.
Critical Resistance and Support Zones
SOL is presently challenging resistance around the $84 level. Buyers have successfully defended the $78.07 support zone, preserving the constructive short-term price structure.
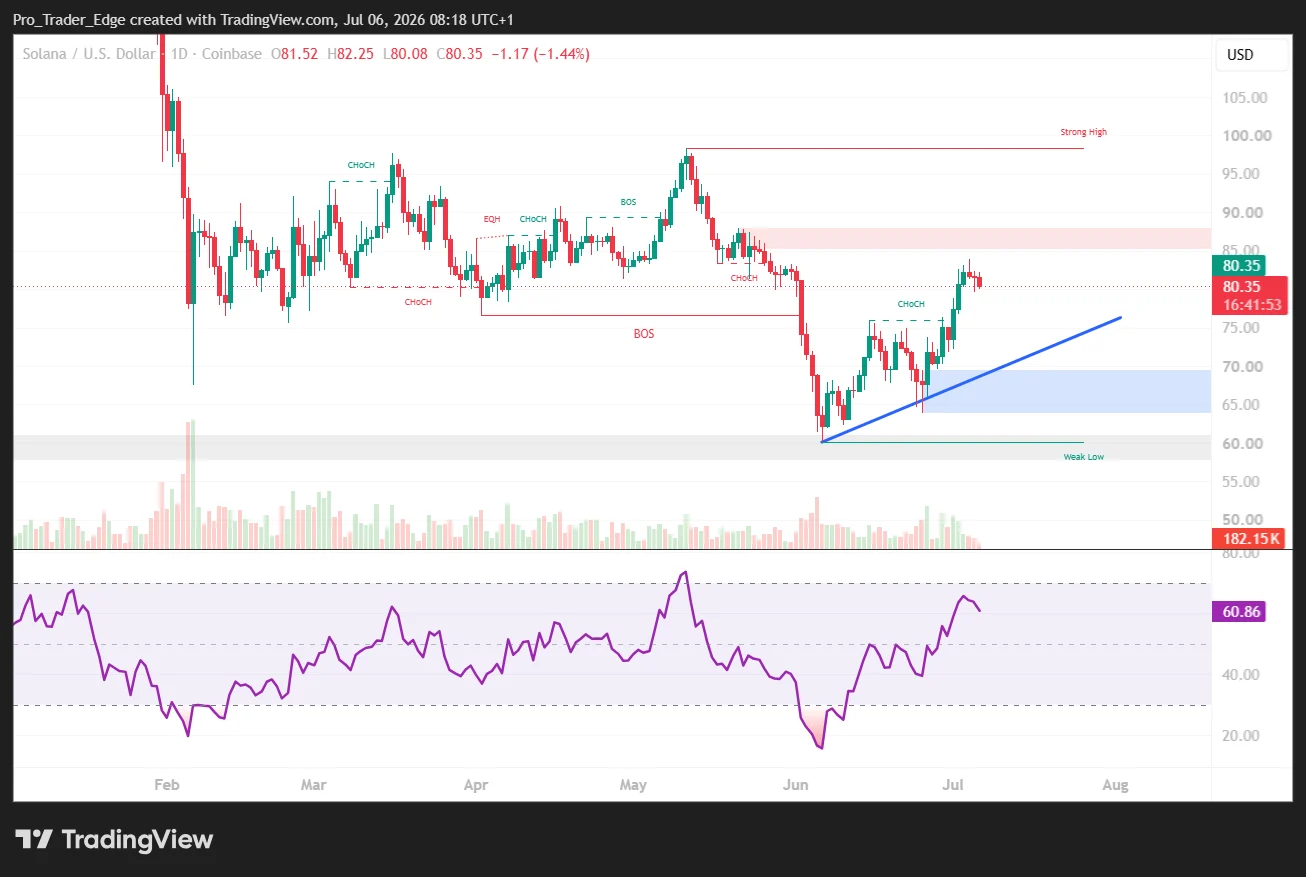 Source: TradingView
The daily Relative Strength Index reads 61.20, while its Moving Average stands at 52.66. Both metrics indicate that buying momentum continues operating above neutral territory.
A decisive break above $84 would probably clear the path toward the $90 level. Conversely, failure at this resistance could trigger a retest of the $78.07 support area.
Examining the weekly timeframe, analyst TraderJB has spotted bullish RSI divergence developing near what he characterizes as the conclusion of a wave C corrective pattern. He observed that identical divergence materialized in opposite form at the prior peak before the correction unfolded.
TraderJB characterized the present zone as offering favorable risk-reward dynamics for spot accumulation strategies, assuming his Elliott Wave analysis proves accurate.
Solana’s most pressing challenge remains conquering the $84 resistance threshold, with subsequent objectives positioned at $90 and $100 should buyers successfully maintain the existing technical framework.
The post Solana (SOL) Flashes Rare Buy Signal After 9-Month Drought — Could $100 Be Next? appeared first on Blockonomi.


You May Also Like
Nvidia FY2027 Q2 Earnings Date: Expected Report Time, Earnings Call, and AI Revenue Watchlist

Why African crypto startups are getting into the lending business

Adakah BN sedia peruntuk Adun lantikan kepada PAS, soal calon DAP



