

Dogecoin Crypto at $0.09: Extreme Fear Meets a Coiled Volatility Squeeze

The meme coin market faces a critical juncture as Dogecoin crypto hovers at $0.09. Multi-timeframe disagreement between bearish daily structures and short-term bullish signals points to an impending volatility squeeze. The market is forcing a choice, and whichever side runs out of patience first will define the next move.
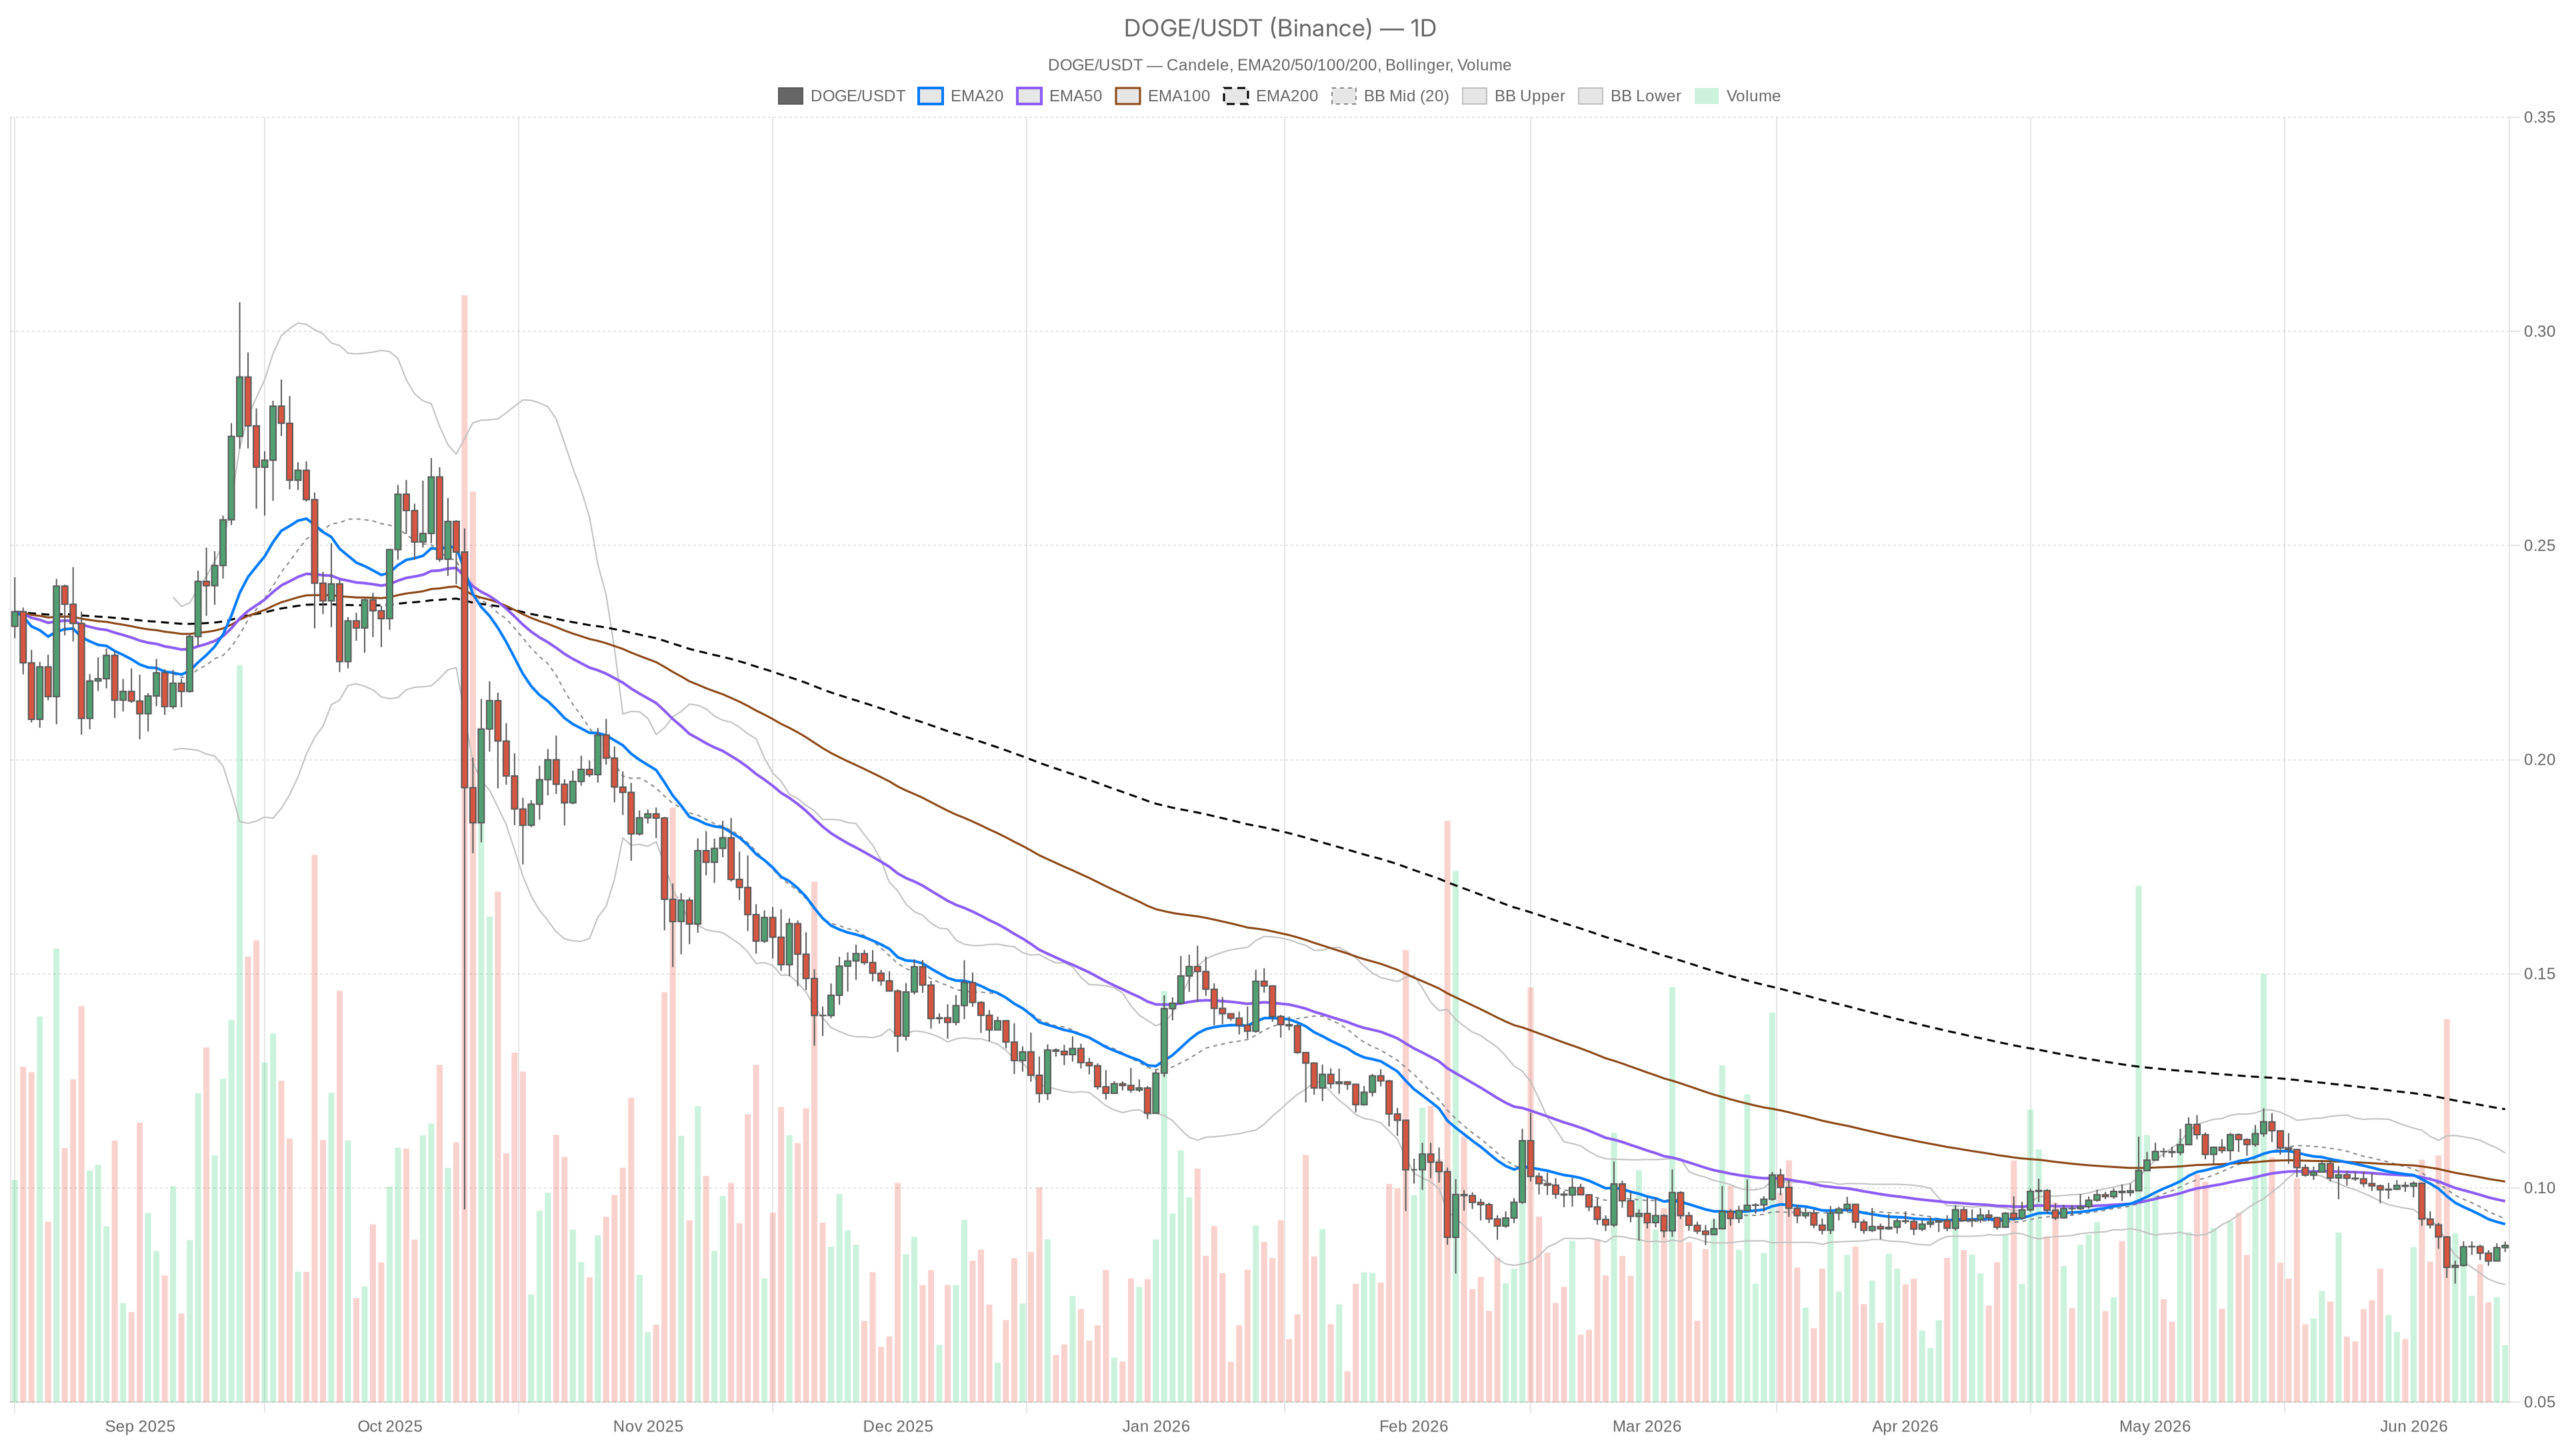 DOGE/USDT — daily chart with candlesticks, EMA20/EMA50 and volume.
The Meme Coin That Won’t Die Quietly
Dogecoin is sitting at $0.09 — a price level that says everything and nothing at the same time. It’s not crashing. It’s not rallying. It’s compressing into a zone where the daily chart is firmly bearish, the hourly is shrugging its shoulders, and the 15-minute is making a half-hearted case for the bulls. That kind of multi-timeframe disagreement isn’t noise — it’s a decision point.
The broader crypto market isn’t exactly rolling out the red carpet either. Bitcoin dominance sits at 56.3%, meaning capital is still anchored in BTC rather than flowing into altcoins like DOGE. Total market cap is just above $2.25 trillion with a modest 24-hour gain of 0.8%, but volume is actually down 3.4%. This isn’t a conviction rally — it’s a drift.
Moreover, when the Fear & Greed Index is printing a 12 — deep inside Extreme Fear territory — you’re not looking at a market hunting for speculative upside. You’re looking at a market where most participants are either frozen or actively reducing exposure. That context matters more than any single indicator on the chart.
What the Daily Chart Is Actually Saying
The D1 regime is classified as bearish, and the structure backs that up. Price at $0.09 is sitting below both the EMA50 ($0.10) and the EMA200 ($0.12). This is a classic double-death configuration that institutional desks use as a hard line in the sand. The EMA20 has caught up to price at $0.09, meaning near-term momentum has flatlined rather than rolled over completely.
However, that’s cold comfort when the medium and long-term averages are stacked above like a ceiling with no windows. The daily RSI at 36.6 is worth paying attention to. It’s not in oversold territory yet — that threshold typically sits around 30 — but it’s close enough to raise the question of whether a technical bounce is loading.
Historically, RSI readings in the 35–38 range on DOGE have preceded short-lived relief rallies before the trend reasserted itself. The problem? RSI can stay suppressed for weeks in a genuine downtrend without triggering anything meaningful. It’s flashing a yellow light, not a green one.
The MACD on the daily tells a cleaner story. The line is at -0.01 with both signal and histogram effectively at zero. That crossover territory is actually the most dangerous zone for traders. It means neither bulls nor bears have full conviction at this timeframe, but the negative MACD line confirms the dominant bias remains to the downside.
Bollinger Bands and the Compression Trade
The daily Bollinger Bands are telling you that volatility has collapsed. Upper band at $0.11, lower at $0.08, mid at $0.09 — price is hugging the midline like it’s afraid to commit. Historically, this kind of band narrowing in DOGE precedes an explosive directional move. Given the bearish regime and macro fear environment, the path of least resistance is a test of the lower band around $0.08.
That said, squeezes can resolve in either direction. If BTC finds a catalyst and risk appetite returns, DOGE has the beta to spike toward $0.11 fast. Pivot levels on the daily are essentially collapsed — PP, R1, and S1 are all at $0.09. That’s the market telling you there’s no obvious technical magnet nearby.
Consequently, price is in a void, which again reinforces the squeeze narrative. When pivots offer no guidance, the next move tends to be driven by sentiment and momentum rather than structure. This makes the current setup particularly volatile and worth monitoring closely.
The Hourly and 15-Minute: Where It Gets Interesting
Step down to the 1H chart and the story shifts meaningfully. The hourly regime is neutral, but all EMAs (20, 50, 200) have converged at $0.09. That’s a flat, directionless structure that tells you short-term traders are not yet committed to a direction. The RSI at 58.2 on the hourly, however, is actually mildly constructive.
It’s above the midline, suggesting buyers have had modest control intraday without stretching into overbought territory. The Bollinger Bands on the hourly are tight — upper $0.09, lower $0.08 — confirming the same compression story we see on the daily, just at a smaller scale. The tension between timeframes is real and worth understanding.
Meanwhile, the 15-minute chart is the most interesting of the three because it’s the only timeframe currently classified as bullish. RSI at 57.8 echoes the hourly reading, and the EMAs are aligned flat at $0.09. This isn’t a raging bull signal — it’s a micro-structure where buyers have a slight edge in the very short term.
For anyone watching for an entry, this is execution context only. It doesn’t override the daily bearish regime. The daily says bears are in charge structurally, the hourly says nobody is pressing hard in either direction, and the 15-minute says short-term momentum is nudging bullish. This isn’t a contradiction — it’s the anatomy of a potential relief bounce within a larger downtrend.
The Two Scenarios Worth Planning For
The bullish case requires a few things to align simultaneously. First, Bitcoin needs to stabilize or push higher, pulling altcoin sentiment with it. Second, DOGE needs to hold $0.09 on a daily close basis and ideally reclaim $0.10 — the EMA50 — with volume behind it. If that happens, the Bollinger squeeze could resolve upward toward $0.11, where the upper band sits.
Furthermore, the hourly RSI already showing above-midline momentum would support that move gaining traction. Invalidation is simple: a clean daily close below $0.088 puts $0.08 in immediate focus. These levels serve as clear lines in the sand for anyone managing risk around this setup.
The bearish case is currently the dominant one and doesn’t need much help. The daily structure, the EMA stack, the MACD negative read, and an Extreme Fear macro backdrop all point toward continuation lower. A break and daily close below $0.088 likely accelerates toward the lower Bollinger band at $0.08. Below that, DOGE enters territory where the chart offers little structural support until much lower levels.
Positioning in a Market Ruled by Fear
With the Fear & Greed index at 12, this is not an environment that rewards aggressive long positions in speculative assets. Dogecoin crypto, for all its cultural staying power and retail loyalty, is fundamentally a risk-on asset. It outperforms when traders feel greedy and gets crushed when they feel scared. Right now, they’re terrified.
The compression at $0.09 will resolve. The question is whether you’re positioned for the direction it resolves in, or whether you’re caught flat-footed when it does. Volatility is coiled here — ATR is effectively at zero in the data, confirming the current stillness — but stillness in markets is borrowed time.
Ultimately, tight ranges breed big breaks, and DOGE has a long history of making both directions feel violent. Anyone watching this asset should be more focused on risk management than directional conviction right now. The macro environment, the daily technicals, and the sentiment backdrop all lean toward caution.
Nevertheless, the short-term buyer presence in the 1H and 15M is a reminder that this market can snap higher without warning if the fear narrative flips even temporarily. Watch the $0.088–$0.10 range as the battleground. Whatever side gets rejected from that range tells you where DOGE is really headed next.


You May Also Like

EUR/GBP Exchange Rate Surges as Bank of England Rate Hike Expectations Intensify – Market Analysis

Binance Red Packet Code 13 June 2026: Claim Free BNB Now

Federal Appeals Court Upholds Sam Bankman-Fried’s 25-Year Prison Sentence for FTX Collapse


