

Solana Price Today: Can SOL’s $71 Bounce Survive a Bear Market?
The market opens with SOL hovering near $71.31, caught between a broken daily trend and an emerging hourly bounce. The Solana price today reflects this uneasy balance — bulls are pushing short-term structure higher while the macro backdrop remains firmly bearish.
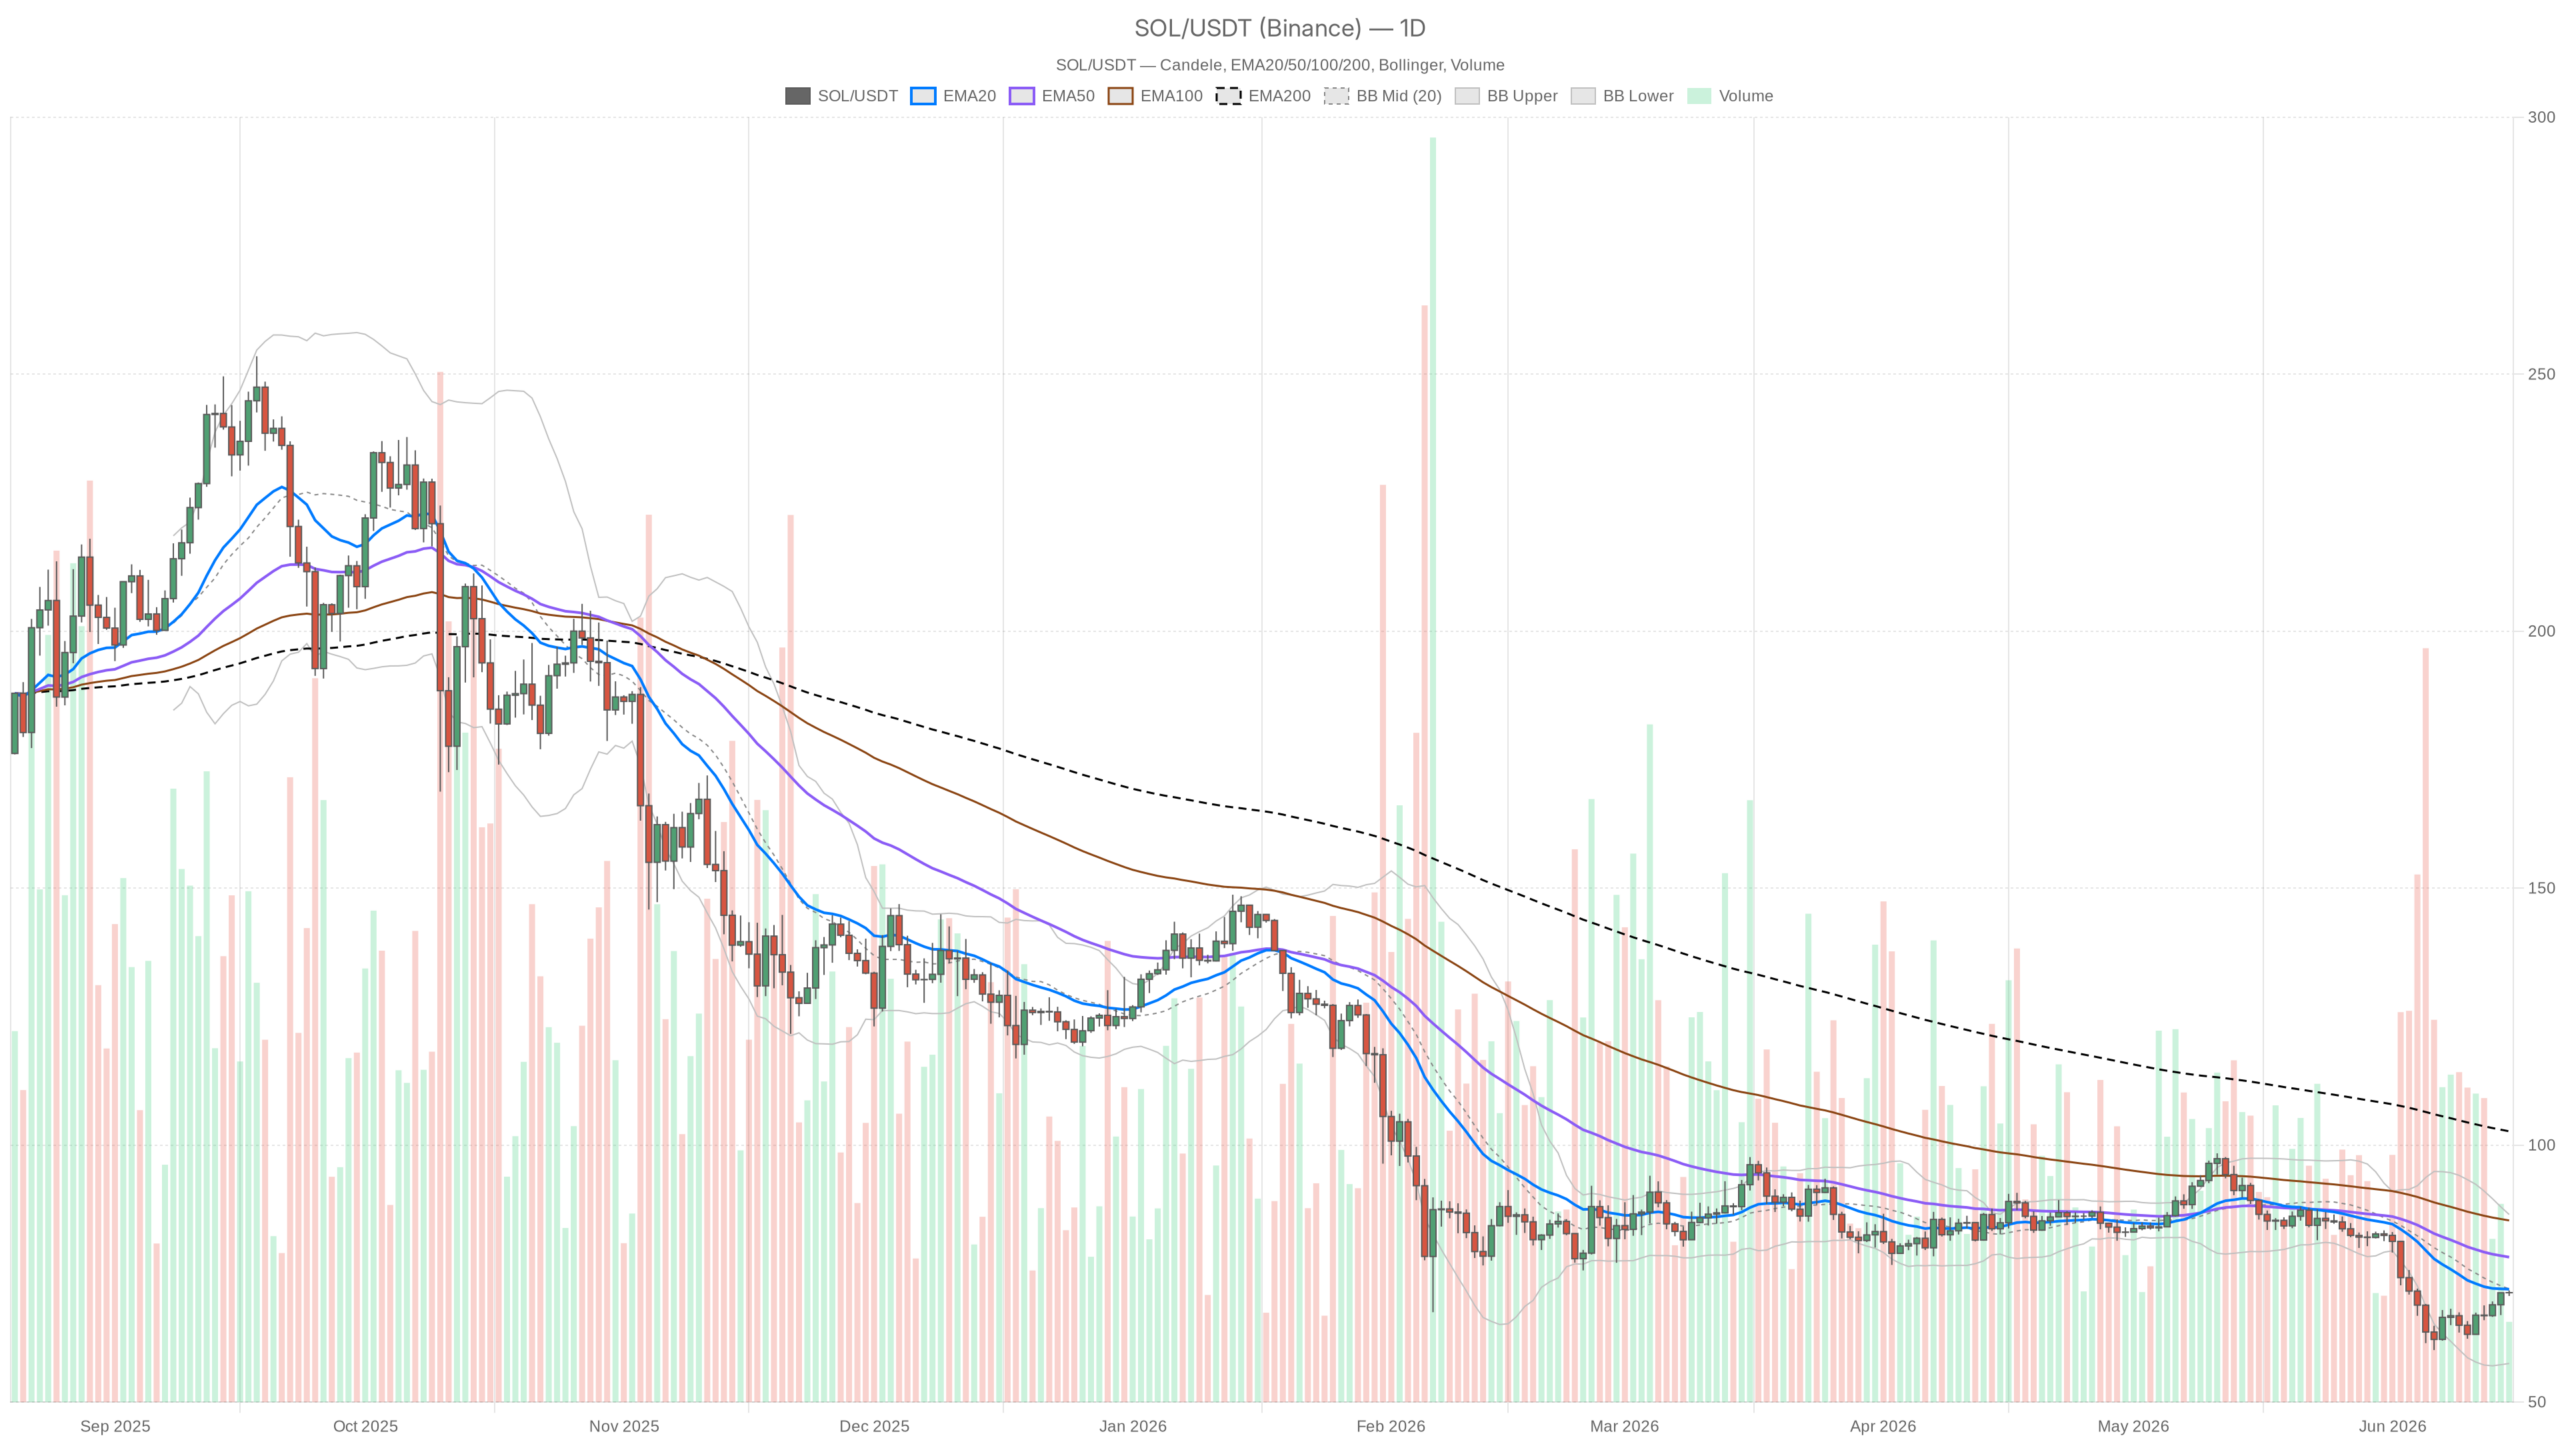 SOL/USDT — daily chart with candlesticks, EMA20/EMA50 and volume.
Key takeaways
- SOL trades at $71.31, sitting below all three major daily EMAs in a bearish cascade.
- The 1-hour chart shows a bullish EMA alignment, but the hourly RSI at 72.35 signals overbought conditions.
- Daily ATR of $4.50 indicates elevated volatility — tight stop-losses are unlikely to survive in this environment.
- The Fear & Greed Index reads 20 (Extreme Fear), reinforcing macro caution on altcoins.
- Solana DEX volumes show a short-term spike but remain deeply negative on a 30-day view.
Daily Chart: Bears Remain in Control
The daily chart confirms a bearish regime without ambiguity — the Solana price today sits below all three major EMAs arranged in a descending cascade. The 20-day EMA at $71.98, the 50-day at $78.21, and the 200-day at $102.70 all stand above current price. Moreover, the 50-day EMA, nearly $7 overhead, acts as a formidable ceiling rather than potential support.
The daily RSI at 44.56 hovers below the neutral 50 line — not oversold enough for a contrarian bounce, but lacking any upside momentum. Similarly, the MACD remains in negative territory with the line at -4.05 and signal at -4.75. However, the histogram has flipped slightly positive at +0.70, hinting that the rate of decline is slowing rather than signaling a genuine reversal.
Bollinger Bands reinforce the bearish pressure: the midline sits at $72.02, barely above current price, while the lower band extends to $57.52. SOL is hugging the lower half of the range. Furthermore, the daily ATR of $4.50 confirms this is not a sleepy market — daily swings of that magnitude keep stop-loss placement a real consideration. The daily pivot sits at $71.23 with R1 at $71.80 and S1 at $70.73.
The 1-Hour Chart Tells a Different Story
In contrast to the daily picture, the hourly timeframe registers as bullish, and the setup has structural logic behind it. Price at $71.31 sits above the 20 EMA ($70.13), the 50 EMA ($68.98), and the 200 EMA ($67.66) — all stacked in ascending order. That is a clean short-term trend structure pointing upward.
The hourly RSI at 72.35, however, deserves close attention. That is technically overbought territory — the kind of reading that often precedes consolidation or an abrupt reversal. Within the context of a daily downtrend, an hourly RSI above 70 signals local exhaustion inside a larger bear move rather than the start of a sustained breakout.
The MACD on the 1H is positive with an expanding histogram (line at 0.88, signal at 0.74, hist at 0.13), confirming the rally has real momentum for now. Bollinger Bands show price pushing toward the upper band at $73.12, which is likely to act as immediate resistance. The 1H pivot cluster around $71.37–$71.56 is the first area to watch for consolidation or rejection.
15-Minute Chart: Momentum Is Fading
The 15-minute chart rounds out the tactical picture and, in this case, tells a slightly more cautious story. The MACD histogram has flipped marginally negative (-0.04) despite a positive MACD line, suggesting the intraday push may be losing steam. Meanwhile, the RSI at 55.21 sits neutral — not directionally useful on its own, but confirming that 15m momentum is fading from its earlier peak.
Price rests just above the 15m EMA20 ($71.25), with tight Bollinger Bands (upper $71.58, lower $70.90) indicating a period of compression. Notably, this compression typically precedes a directional move. Whether that move extends the hourly rally or reverses it feeds directly back into the macro question.
Solana DeFi Activity: Volume Offers Mixed Clues
On-chain activity across Solana-native DEXs paints a mixed picture, according to DefiLlama data. Raydium AMM, Orca, and Meteora all posted positive 24-hour fee changes — up 17%, 61%, and 11% respectively — suggesting a short-term spike in trading. However, zooming out to the 30-day trend reveals a deeply negative picture.
Orca is down 56% in fees over the past month, Raydium down 44%, and Meteora off 24%. This is not a recovering ecosystem — it is one bouncing off low-activity levels. A single day of elevated fees could be a flush of pent-up volume or a speculative burst, not a sign of structural DeFi resurgence on Solana.
Two Scenarios That Define SOL’s Next Move
SOL’s next move depends on two clear scenarios: a bullish breakout above the daily EMA20 or a bearish rejection that confirms the macro downtrend. The bullish case requires a specific sequence — SOL must clear and close above $71.98, then challenge the 50-day EMA at $78 on daily closes. If hourly momentum holds and the broader market sustains its gains, the Bollinger midband at $72.02 becomes the first checkpoint. A daily close above $73–$74 with expanding volume would be the first credible sign this bounce has legs.
What would invalidate this scenario? A rejection at $71.80 (daily R1) followed by a close below $70.73 (daily S1), confirming the daily structure remains dominant.
The bearish case is the higher-probability setup given the daily regime, EMA stack, and a Fear & Greed reading of 20. If the hourly RSI at 72 rolls over and price fails to break $73 with conviction, the path of least resistance is a retest of the $68–$67 zone. Here, the hourly 200 EMA and key support converge. A breakdown below $70 on the daily would add significant weight to that scenario and open the door toward the lower Bollinger Band at $57.52 as a longer-term target.
What would invalidate the bearish view? A decisive daily close above the 50-day EMA at $78.21 with strong volume. That said, nothing in the current data suggests this outcome is imminent.
How to Approach Positioning Right Now
This is one of those setups where the timeframe you trade matters enormously. On the daily, SOL is a broken chart in a bearish regime — anyone holding with a multi-week horizon is sitting in what the data describes as a downtrend. This is reinforced by a market dominated by BTC accumulation and broad risk-off sentiment. On the hourly, however, a real and technically valid bounce is underway — one with structure, momentum, and EMA alignment behind it.
Those two realities do not cancel each other out; they define the risk. Short-term traders have a legitimate setup to work with up to $73, with the understanding that the daily backdrop could end that move quickly. The ATR of $4.50 on the daily means volatility remains elevated — this is not a market where tight stops survive.
Uncertainty is high, Fear & Greed is historically pessimistic, and the macro structure has not turned. Anyone engaging with SOL here should size accordingly, respect that a 72 RSI on the hourly is a precarious entry point for longs, and have a clear answer to the question: which timeframe am I actually playing? The data does not offer a clean directional bet right now. It offers conditional scenarios — and honest risk management is the only appropriate response.
FAQ
What is Solana’s price today?
As of June 15, 2026, Solana trades at approximately $71.31, sitting below all three major daily EMAs in a bearish structure. The broader market context includes Bitcoin dominance at 56.6% and a Fear & Greed Index reading of 20.
Is Solana in a bearish or bullish trend right now?
The daily chart is firmly bearish with SOL below the 20, 50, and 200-day EMAs. The hourly chart, however, shows a short-term bullish bounce with ascending EMA alignment — creating a tug-of-war between competing timeframes that traders must navigate carefully.
What are the key resistance levels to watch for SOL?
Immediate resistance sits at $71.80 (daily R1) and $73.12 (hourly upper Bollinger Band). A credible breakout would require a daily close above $73–$74, with the 50-day EMA at $78.21 acting as the major structural hurdle that bulls must overcome.
Is Solana’s DeFi ecosystem recovering?
Despite short-term DEX fee spikes on Raydium, Orca, and Meteora, the 30-day trend remains deeply negative across all major Solana-native platforms. The current bounce in activity likely reflects temporary volume rather than structural recovery.
Disclaimer: This article is for informational purposes only and does not constitute financial advice, an investment recommendation, or a solicitation to buy or sell any financial instrument or cryptocurrency. The analysis provided is not indicative of future results. Investing in crypto assets and financial markets carries a high risk of capital loss. Always do your own research (DYOR) and consult a qualified financial advisor before making any decision.
Article produced with the assistance of artificial intelligence and reviewed by the editorial team.


You May Also Like

FIFA World Cup 2026 Prize Money: How Much Will the Champions Earn?

Upcoming Crypto Listings: Important Updates Investors Should Watch

Which Country Has Won the Most FIFA World Cups? Complete World Cup Winners Ranking


